Weekly Commentary
"Prices move until the marginal efficiency of other assets falls in line
with the rate of interest" Keynes 1936 |
Aug 11/07 - It is the white knight to the rescue of the
markets in the form of the Fed and the ECB. It was a volatile week but the
markets ended virtually unchanged. Why did the Fed feel the need to
intervene since we have not had a healthy correction in over 3 years? The
main reason may have been that banks do not want to lend to other banks in the
form of overnight deposits because they may wake up to another bust company.
After all, why does your bank have so much leverage? One of the reasons is
that this may be has do in fact to do with the low volatility that we have had.
This makes the return on some assets much lower and may also reduce the risk but
you have to get leverage. The other important point this week has been for
corporations that borrow from commercial paper sales. This week the CP
rate jumped to 5.5% which is up 0.32% for the week. This is important
because if they are now having a harder time getting short term funds it will be
that much more difficult for consumers. Look for credit card rates to move
higher in the near future and our estimate for commercial paper is rates of
6.5%. The widening of credit rates does not bode well for the
economy into next year as capital now has a higher hurdle to produce good
returns. Finally, our studies of commodities have signalled a top in the
CRB index and the market may have called Bernake's bluff of not saving the
market. Look for the potential of a rally on the Bernake PUT.
July 21/07 - The week was going good until GOOG came out with
earnings that were great but the market was looking for reasons for a sell-off.
However, we feel that this is a temporary shift in market behavior as even
string earnings are temporarily now considered not to be enough to push stocks
and markets higher. Let think of it like this - if google has great
potential and has great earnings then my stocks that have just average earnings
are not likely to perform. This seems a bit flawed in our opinion and we
expect the market to bottom sometime mid week as volatility is likely to spike
over 19 as measured by the VIX. In the bond markets there was a flight to
quality even as subprime hit new ABX lows and the Alt A mortgages also began to
decline. This decline in the
Alt A mortgages
is disturbing and any signs of further weakness should be regarded as coming
higher default rates from the re-setting of mortgage rates as the teasers begin
to come to maturity. The USD continued to make new lows as more bad news
about the presidents ratings fell to record lows but if the dollar is so low
then why is everyone buying the treasuries - including foreigners (perhaps there
is no where else to move all that liquidity). That liquidity is what we
expect to move back into equities.
July 14/07 - The best comparisons in investing may not come
from the world of psychology as has been the recent revival of behavioral
economics. In games of psychology the end is often know and games are played
in attempts to get the maximum payoff. Total profits can only be increased at
the expense of the competitors and the brokers take a guaranteed slice of the
pie as "we" compete against "them". In comparison to biology the end of a life
cycle can only be estimated and there is not some attempt at a one time maximum
payoff but a steady stream of food for conversion into energy. Nutritional
intake is of up most importance as starvation can lead to stress and eventual
death, often as short as a few hours for bats and a few weeks for people. So
why do people play the markets based on theories of the Prisoners Dilemma, Game
Theory, Home Run Hitting or random behavior like coin tossing? Coin tossing may
not be all that random as its outcome is impacted by the force the coin is
tossed, wind speed and in some cases cheaters may be at work fixing the system
by extracting a fee for each toss. A need for a steady income stream is the
promise in hedge fund as there profits are from alpha as opposed to beta which
tends to be too volatile. The markets may have an upward drift but an aging
population does not have time. Our SPX/USD trading model held long through the
biggest one day rally in over four years but volatility is suggesting that the
rally is limited and next week earnings release promises more variance in
stocks. In the bond markets our systems point to higher rates as 10 year rates
are coming off lows of 5% and short term corporate rates are starting to move
higher.
July 8/07 - Interest rates dropped briefly below 5% on the 10
year notes but then reversed course and made a run to 5.20% and short term rates
also moved higher. The sub prime fiasco continued with rumors that BS hedge
funds were being offered 10 cents on the dollar for their subprime bonds. This
is hard to believe and if the fund would have been forced to liquidate then
there would have been a firesale. Anyways the truth is that the market has
already built sub prime issues into the market prices and that if further
adjustments are needed , well at this time we do not know. Next week will bring
earnings reports from Alcoa and Pepsi and a host of smaller companies and we
expect volatility to pick up in anticipation of the week after when Intel and
Yahoo among others report. As Yahoo recently replaced the CEO we can expect
some surprises on the downside there perhaps. Short term upside on the SP seems
limited at this time. With rates rising and the China market having slipped 15%
from its high it appears that our commodity call last week may have some time
to run on the downside.
June 30/07 - It was a volatile week but volatility and
interest rates fell by the end of the week. to that tune we will no longer be
providing signals on the SP or the nasdaq and have discontinued our COT service.
It is of our opinion that COT is delayed and that upon analysis there is margin
value being added by delayed data. On the equity front we can get much
better information from variables such as interest rates, inflation, and market
volatility. For it is these factors that lead us to the equity market in
search of better returns. There was an interesting development this week
as our CRB index is flashing a sell signal for
Monday. The CRB index has been moving sideways for a number of months but
the one wildcard will be oil. On the interest rate world short term and
long term rates continue to signal higher rates over the coming month. In
particular this may be lead by higher commercial paper rates as investors start
to move into other investments.
June 24/07 - It was a volatile week and the bond market was
the place of the flight to quality. Most of the news was about the sale of
bonds at Bear Stearns and now Merrill was wanting to sell off some of its hedge
fund bonds as sale prices but at the last minute Bear came up with collateral
for the fund. In the markets there was little news but investors jumped
back into bonds for now. We continue to look for a higher yield curve and higher
rates. Please click on the graphs on the right for more insight into our
model predictions.
June 16/07 - Are projection of higher markets came to bear
fruit after a down early week and the bond market delivered higher rates.
By week end it was clear that the core rates are falling on the inflation front
but the inflation rate including food and energy is on the rise and fast.
Will this filter into the core rates? That is the million dollar question
as the Fed's do not want to pay further benefits and the biggest core of
inflation is the Owners Equivalent Rent. The biggest jump we noticed in
commodities was the jump in the
prices of wheat (read as bread and dough for donuts amongst other items).
We believe the yield curve
will continue its upward move and rates will be higher in the coming months
unless there are changes in the flow money and inflation expectations.
June 9/07 - The bond market does not answer to equity
holders, it only needs to be compared to other countries. The bond market took
a beating this week as the 10 year bonds topped the magical 5% mark with a
jump. The 10 year bonds last topped on June
28/06 at 5.24% and began heading south. Bonds need to be compared to rates in
other countries as money is liquid and currency fluctuations can be hedged.
Further, the demand for money from the big takeovers is up 50% over last year as
the smart money has been issuing the junk bonds as fast as they can. The yield
spreads have been incredibly low considering that deficits are climbing, and as
we see from the Canadian and European
Markets higher rates are not just a US issue. A strange occurrence happened
this week as all three of our daily directional timing systems issued a strong
sell signal. Further, the SP-USD strategy gave a sell mid week and the markets
turning strongly lower Thursday. In the coming weeks there will continue to be
pressure on US bonds and the yield curve will move into higher positive
territory as investors remain anxious about parking there funds into either
equities or bonds. The Group of Eight summit also this week may not be going
all that well as Russia had some tough words prior to the meeting and this may
have changed the agenda and sentiment of attending members. In the coming week
we expect further equity market upside and decreased market volatility. There
may be unwinding of the carry trade as the Japanese Yen
is projected to move higher. On the 30 year
bonds an important point will be at 107.00 on the futures market.
June 02/07 - The week set new highs in the
S&P and bonds made a run to the 5% mark.
The missing piece of the puzzle is the projected rate of
inflation. Our models are looking at a jump in inflation over the
coming weeks. The other inflation (hedge) GOLD
is also going on a buy on Monday. Retuning to the main story of bonds
this week we expect rates to move higher leading to lower bond future prices
(this includes the bond ETF TLT). The
yield curve is moving higher and short term rates remain low relative to
upcoming inflation expectations. Amazingly, our earnings
expectations system is pointing to higher earnings and some of this is most
likely due to corporate buybacks (such as IBM).
May 26/07 - The markets continue to flirt with record highs
but for some reason are unable to penetrate into new highs and remain there.
In particular the small caps have been hit hard after making new highs on the
Russell2000. The equity markets may experience a small sell-off early in
the week to make a recovery over the next few weeks as our volatility strategy
is jumping in with both feet early Tuesday morning. There is however a
different picture over on the bond markets as the recent sell-off has left a few
bond traders scratching their heads as the economic indicators have been
conflicting over the last few weeks. Finally, the REIT market seems to
moving lower in sympathy with bonds and we are working on a strategy for this
volatile market.
May 19/07 - Wall Street was abuzz with takeover rumors as
Microsoft finally made a play to buy out aQuantive Inc. for about $6 billion in
cash. Will this be the bet it makes to offset the technological advantages that
google currently has? The equity markets fell then rose and ended where they
basically started the week. The story was different for the bond markets as the
10-year rates moved from 4.68% to 4.80% and bonds trended lower. Our
expectation has been for both short term and long term rates (next critical move
of 5 year rates above 4.7%) to move higher with a
flat yield curve in the near future. Rates have stubbornly stayed low with
world liquidity looking for places to park their excess funds, this week however
China made a 3 billion investment with Blackstone in a sign that they are
looking for higher yields and have tolerance for more risk (but 3 billion is not
a sign of a significant change of policy). Alan Greenspan joined the Bond King
of Pimco, as pimco was right last year on the housing market but incorrect on
the path of interest rates. Gold finally made its move lower and our systems
have been on the wrong side for some time with this commodity but correct with
anticipation of a higher Canadian Dollar (another commodity play). Finally,
there was a paper released by ANDREW W. LO of Massachusetts Institute of
Technology (MIT) -
Sloan School
of Management on Where do Alphas Come From?: A New Measure of the Value of
Active Investment Management. Among other items it discusses the returns of
funds based on "measures the portion of the manager's expected return due to
static investments in the underlying securities, …the forecast power implicit in
the manager's dynamic investment choices".
May 12/07- Interest in VIX Futures set a new record this week
as some investors got the jitters on Thursday. This brings us to an important
observation about market sentiment. Investor sentiment is often identified as
being at extremes at major market tops or bottoms. However, market sentiment
is being pushed as a market-timing tool, even with the following problems.
Often data is collected from individuals over the previous week and thus it is
already delayed, other investors have access to this data before the user
(people seem to forget about this lag), sentiment is most often a past
reflection of the markets and not a harbinger of things to come and lastly
sentiment is an observation of feelings and not where one is putting their
money. With the above issues, then one can conclude it would be useless in any
trading models and that is why web pages that display this data (and often
charge for it) do not show it in any useful trading model. The eyes have a way
of deceiving us on relationships / correlation's. In the bond market prices
moved lower as an increase in UK rates put pressure on this side of the ocean.
We expect to see continued weakness in bonds and a rise in VIX in the coming
week.
May 06/07 - The markets have been up for five weeks in a row
and the odds of a six are on the low side. There has been much talk of
market momentum but according to a new paper from
Hwang, Soosung and Rubesam, Alexandre,
"The
Disappearance of Momentum" (March 2007) it has all but disappeared since
2000 from the markets. If this is true then mutual funds and those that
depend on momentum based strategies will continue to under-perform the market
for the foreseeable future. Market volatility will
spike higher this week as we enter a critical zone in volatility over the next
few weeks. The bond market is on a sell on our daily system as the lower
USD has yet to have a significant impact on other markets. We would go as far to
say that the dollar does not matter as all the players have their eyes on the
markets.
April 28/07 - Leveraged buyouts may be great for the stock
world but for some bondholders (such as BCE) they are experiencing downside
pain. Why would a takeover not be so good for all? One possible reason is that
when the company is taken over and stock is retired (bought out) the new private
company will issue new debt to finance the company and to some extent the
buy-out. This may hurt current bondholders as the company margin may cause
rating agencies to cut debt from investment grade to junk levels. In this case
current bond holders are in ambiguity as they are uncertain if there bonds will
also be retired along with the stock. Investors in the bonds react
asymmetrically to such ambiguous news. In this case the current bond holders
have some information indicating the arrival of bad news. This is intangible
information, yet the market has decided to act upon it as it was tangible
information. Future buyers of the bond (the people who set the price when
ambiguity is high) require compensation for the increased uncertainty.
Ambiguity differs from volatility as volatility is about market expectations and
ambiguity is about the quality of the information. When investors begin to cast
doubt on tangible information then the result is volatility. Our
strategies continue to support a market rally but
volatility will be making a comeback over the next two weeks unless new
information leads us to believe otherwise.
April 21/07 - There seems to be a lot of pessimism out is the
markets these days and the Margin Debt levels may not be a good reflection of
real margin as the short sellers are part of the borrowing. Previously short
selling was not this big but with true hedge funds this has changed and we must
re-evaluate some common markets indicators in this light. I will also add that
when any data is delivered with a lag that it losses much of its punch as others
have access to the data prior to the public. When traders start to look for
market correlation's they are bound to see that B follows A and that it happens
more often than not. This off-course is just a quick computation and is often
only tested on the last data period available (as this the most recent in
memory). I would caution that as follows B more and more that the scenario is
more likely coming to an end, as other traders will have also picked up on the
pattern. The pattern is definite to end when someone publishes a paper of a
book on it, just like the incredible January Effect, presidential cycle or the
Dogs of the Dow. In this end we will be changing our ES trading model to one
that has been a more consistent winner and uses variable different than the
current version. The following week appears to remain bullish with the
exception of volatility and lower earnings from the not so high profile stocks
in the SP500. If there is a market drop coming it will not be a buying
opportunity as have been the past drops which were accompanied by
earnings estimate increases such as 1987,2003 and
even the recent 416 point plunge for the Dow Jones Industrials on Feb 27/2007 on
our earnings model.
April 14/07 - Market Earnings
are the lifeblood of the markets, if there was never any possibility of profits
nobody in their sane state of mind would invest in stocks. Thankfully, the
earnings of the S&P 500 are positive and lately have been positive in a big way.
As go earnings so normally goes the market and earning estimates are the
biggest big business in the investment industry. Why then are earnings
difficult to predict even with good knowledge of a company or industry?
Earnings Projections are just as difficult to forecast
as the markets due to the number of variables in the
economy. For stock valuation, company specific earnings
are in many cases he basis of buying the stock. This is
apparent on earnings day, as any deviations from the
forecast are meet with extreme volatility. Earnings
forecast keep broker analyst busy writing reports for
current and potential clients, this helps to sell as the
firm appears to be providing investors something
tangible of value that the client would not have the
time to research. It may produce a tangible report but
the variables used in the report are far from being
tangible to forecast - it is not like measuring how high
a tree will grow using measurements such as soil
condition, moisture and hours of sunshine among other
factors that can be directly measured.
The truth be told as the economy changes so do the
fortunes of any individual company on average. This
means that earnings rise and fall along with the
variables that impact the economy and the costs of doing
business. Some of those costs are the cost of
borrowing (such as outstanding debt that most companies
have) and the ability to price products based on costs.
This means that as these factors change so must earnings
estimates. Normally estimates are revised when earnings
are released as investors have an appetite for the
unknown.
Our
model of SP500 Earnings Forecast is based on macro
indicators mentioned above and on various estimates of
potential risks (volatility of earnings). As in the
Black Scholes model of option pricing we believe that
the best estimates are made with the most current
information. At this point we do not attempt to focus
on individual companies but the market as a whole. The
free cash flow model is the preferred method of
corporate evaluation but that is more difficult to
calculate (with fewer errors) so the earnings estimate
may be the next best thing. Further earnings come out
quarterly and give investors something to bite into
until the next quarter.
April 08/07- The market has
been reduced by some to just a mathematical formula full of ratios and models.
This may work for them in the current environment but unless they show the
willingness to adopt then those models will in the future expire. What has been
neglected is the human will to change to new and unexpected events or to carry
markets to an extreme. These can not be measured with accuracy but we can
attempt to time when these changes may happen by looking at volatility. In the
markets, volatility is the temperature of the markets - the higher the
temperature the more extreme the markets tend to be. At periods of high
temperatures are the times of opportunity as market participants are open to new
ideas as older held beliefs may have lead them astray and filled their thoughts
with uncertainty. This is also the point that collective behavior works its
magic, the magic of leading the crowd in the right direction. This is similar
to a group of people guessing the number of jellybeans in a container even when
individual guesses are very incorrect. On the markets, interest rates may be at
the point of high influence as investors have been placing bets on bonds at a
higher rate (as witnessed by increasing futures volumes). Rates now look poised
to move higher. Vix is also signaling more surprises in the coming
earnings season.
March 31/07 -The markets are
the home of uncertainty and of bears and bulls attempting to figure out the
future course of the markets. This uncertainty is all in the data according to
the Fed and it will be resolved by the data, so if the Fed is unaware of the
state of the economy how could other investors be too sure. Well, nobody can be
certain no matter how good our observations but we need to have the ability to
out think our opponents in the markets. This may be called gaming or a version
of the predator/prey model but in the markets the net sum is zero minus
commissions (some may argue that there is an upward drift in the markets that we
have not accounted). In gaming the market, the biggest mistakes are often the
times that the market is moving fast and we are unable to cope with this sudden
volatility. There does not exist any single market model or formula that
describes possible market outcomes. The best we can accomplish is to identify
the possible variables and give a probability of possible outcome. Any possible
theory we hold about the market has value in explanation, not of the future
outcomes. The most important factor in trading may be flexibility, to take
corrective action to avoid serious risk. Market theory needs to take into
account that people react, learn and anticipate other traders behavior. Market
uncertainty is not going to be solved by an abstract formula, as information
itself is imperfect. Finally, even if a pattern/formula were effective in
determining the market direction, the markets nature would assure that the
future pattern would be altered.
March 24/07 - The market got a heart jumpstart after the Fed
meeting and the shorts were scrambling to cover. As the subprime market
starts to stabilize and some hedge funds think they are getting a deal by buying
these loans at 96 cents on the dollar. Well, we think this will come back
to haunt some of these early vultures. This brings us to the leveraged bet
that individuals and funds are taking these days. The low volatility
periods have been the best of days but making overleveraged bets are a sure path
to ruin. This is the equivalent of writing naked puts and getting a great
sharpe ratio until some future point. In the risk business this is called
left tail risk or negative skew. Why are we discussing leverage at this
time? Just think back to a few months ago when customer margin
accounts were at record highs. Well that seems to have also blown away but
there now exists the potential that consequences from that event may hit the
market. It is consequences of consequences that moves the markets and not
the latest number of the macro economy.
March 17/07 - It was the week of options expiry and some
believe that markets tend to decline in such week, but we have not been able to
test this theory. What we do know is that options expiry can not be as
important as before as now we have option expiry every week on some options and
month end expiry on many others. I would not suggest trading options (due to the
time decay factor and the timing and directional factors) but it plays an
important role in traders beliefs. In for one, informs us of the implied
volatility for stocks and indexes and this has historically been very accurate
in predicting the variance of markets. If this were not the case then we
could arbitrage the opportunity to our benefit. Alan Greenspan continues
to warn of a slowdown in part to profit margins being at record highs and we are
monitoring this closely, as employment and capital spending goes in the
direction of profits. In the bond world, interest rates continue to dance
around in the 5% region for short term rates and the longer rates do not feel
any impact from the subprime fiasco. The S&P based on USD
returns remains bullish as does volatility.
March 10/07 - The markets moved higher and the subprime
mortgage market has tanked along with the ABX index as some of the liquidity is
drying up. Can the subprime damage be limited to holders or will it spread to
other mortgage providers? One stock that will be impacted in the coming weeks
is Fannie Mae (FNM). We suspect that most private equity and hedge funds have
hedged themselves and that one need to closely follow the REIT market (^RMZ on
http://finance.yahoo.com) to notice any cracks in this large market. We
have been working with a number of models over the last few months and the SP
measured in USD funds appears to show good gains and has been benefiting form
the "YEN carry" trade confusion. The confusion surrounds how big this market
is? It has been our experience not to measure markets where there is no index
for comparison but to stay informed on how investors may be affected by such
news. Market volatility topped off early Monday morning and has been heading
south rather quickly as volatility sellers (option writers) have taken this
opportunity to sell options to anxious bears. It appears that many traders were
hoping for a 10% correction (that much talked about number) before moving back
into the markets but the market is least accommodating when investors have a set
target. This created a large pool of investors that were sidelined and have
been coming back into the market over the week with the realization that the
markets are moving against them. Next week we expect a top early Monday with the
markets heading lower for the remainder of the week. In the bond markets a
strong jobs report on Friday confirmed that the economy is still strong and that
earnings are growing at an inflationary pace. Bonds at this point are also on a
sell but Gold stocks (XAU) are signalling a rally ahead.
Finally, we will continue to closely monitor corporate earnings as the earning
margin may be at unsustainable levels and future corporate profits may be lower
than anticipated.
Mar 03/07 - It starts in the east and spreads to the west
that about sums up what we saw this week on Wall Street. Our quantitative
models remained locked in buy mode. It is our belief that some of our models
use similar inputs as those used by hedge funds thus they are subject to jumps
in volatility. A few weeks back (Feb 10) we advised being out of the market
while the VIX models were signaling a rise in volatility.
This saved us a lot of headaches as we prefer to only play the long side while
volatility is falling and diversify into plays on GOLD
and the Bond Market. Someone must have
hit the panic button with investors as this was a total surprise for all
involved but the ABX index might have provided some insight into credit
problems. There was not much news but the selling seemed to come out of nowhere
but appeared everywhere, with the exception of long term bonds. The selling is
in fact playing upon the moral factors that produce panic and investors try to
stay ahead of the selling on the other side of the world. In the end it will
depend on corporate profits but if a trillion dollars is wiped of the market in
a week then buying power drop somewhere in the economy. On a final note, the
selling in Gold may simply be a result of traders not selling losing positions
and taking funds out of the gold market to cover margin calls and our Asset
Allocation Model is recommending buying bonds and shorting the Russell2000 as
equity premium is too high for these small caps.
Feb 25/07 - Surging worldwide liquidity has been accompanied
by rising bond and equity markets. The equity markets have been helped by
an ever rising corporate profits, as a percentage of GNP they are at 40 year
highs. this level has not been seen since 1965-1966 and the low was
reached in 1982, the beginning of this great bull market. Corporations are
a mixed group that finds funding where it is cheapest ie. either by stock
issuance or bonds and today they have expansion plans on their mind (private
equity), they can get cheap financing from the bond markets. this is
evident in the junk bond market where the spread over treasury is razor thin.
Why has the default rate remained so low? It is nearly impossible to
default in the markets continue to purchase your new batch of bonds or they can
be repachaged to appeal to investors. An example of this is the housing
market, people have had access to easy money - think subprime. The
subprime market is now having its own problems (see the implode o meter site at
www.ml-implode.com ) or you can look up
the ABX index, which has dropped like a rock. The funds are beginning to
draw up so I suspect it will be a tough year for that market. This brings
to mind the GM fiasco earlier this year as their debt was cut to junk but the
stock continued upward soon after. The difference that comes to mind is
one is a corporation vs individual and liquidity was there for the taking vs
todays liquidity. In the bond market short term rates rates are moving
higher (slightly) and longer term rates remain in a downtrend. The equity
markets look poised to move higher and Microsoft that we mentioned a few weeks
ago as a short looks to have bottomed out with a 63% of moving higher over the
next weeks. Any sign of trouble continues to be in the low VIX readings
but with all the bearishness out there it is difficult to not remain bullish.
Feb 17/07 - The world of asset allocation has a major impact
on equity markets as funds flow into markets that are expected to benefit from a
robust economy. As all assets are in competition with each other, money has a
tendency to be allocated to those who are able to best invest it in growing
sectors of the economy. This may not always be the case but in capital markets
this is the general logic. Our interest at Marketpit.com is to allocate funds
between the 10 year treasury and the S&P equity market. This is important as
investors will have to decide to be conservative by buying bonds or to be
expecting strong earnings from firms in the S&P. A stock could be considered a
bond in perpetuity with an uncertain rate of return but the bond has a constant
stream of income. The price of uncertainty is called the risk premium as
investors do not want to hold stocks when they decline. Our strategy is to use
the Stock vs Bonds analogy. It is a comparison of the Russell 2000 divided by
the 10 year treasury and tells us the ratio of of the cost of debt vs equity
risk. With a current ratio of 7.5 you could buy 7.5 units of bonds or 1 unit of
the small cap index. It has moved between 3.5 and 7.8 since 1993. It made a
high in early 2000 and is just now approaching the same level. What this means
is that you could have invested in Bonds and have made the same return as the
Russell 2000 over the last 7 years with much less volatility and a lot better
sleep at night. However based on our analysis you would have been invested in
equities since 2006 and have made double digit gains as compared to bonds over
the last year. In the bond markets the yiel curve surprised us and is heading
south with short term rates poised to head higher. Gold and the XAU gold
stocks remain on a sell and we may see some of that sell-off this week. On
the equity markets we are bullish on the SPY and the QQQQ with both strategies
on a buy. One caveat is that volatility remains at low levels and our
volatility strategy is calling for an increase.
Feb 10/07 - Volatility waited till week's end to show that
investors have become too complacent but was it just to shake out the so called
weak hands as the economy hums along at a steady clip? We at marketpit have our
own measure of volatility and it is important to us in our own trading for one
very important reason. When volatility is rising
(signaled by an up arrow) there has been a net market gain of 7 spy -the S&P
500 ETF- points since 1992 (when the SPY started trading) and a net gain of 25
spy points when a second signal of rising volatility is added (these are
gains on short positions). What does this mean to risk? This means that by
being out of the market while volatility was rising we could have gained the
entire upside potential of the S&P 500 by only being invested while volatility
is declining (shown with a down arrow). Our risk is lowered by almost 50% while
maintaining the full potential of the upside. What this does not mean?
Is that we would have caught every rally and avoided all declines ( that would
be impossible and do not believe otherwise). But over the time period covered
1992-2007 by being out of the markets while volatility rose we could have been
safely invested in t-bills and made an extra few percentage on our capital.
Feb 04/07 - Trading is not about being right on your opinion,
it is about getting is less wrong on your trading than the competition.
The market place is a place of price discovery mixed with a large amount of
noise and people seem to presume there is such a thing as smart money and that
somewhere there are individuals who know what is the right time to invest long
or short. The being right should be replaced with being less wrong and we
will make some great strides towards better trading (and less stress). We
all bring a unique perspective to the market, some are technical, trend
following, fundamental, quantitative, momentum, risk adverse volatility traders
etc.... and somehow prices get accurately reflected for the most part.
This week in the equity markets should mark a down week as both the emini and
qqqq strategy are on a sell signal. There is also evidence that Microsoft will
experience weakness as Vista sales may not go as expected and thus earnings
revisions may be needed. In the bond markets are short term trading is long but
over the course of the month we expect to see higher rates along with a positive
yield curve over the next few months. One of the big events will be a fed
refunding this week and there is a possibility that it may not be as strong as
in the past. Market volatility is near all time lows and we continue to
expect a jump in these numbers this week.
Jan 27/07 - It has been a challenge for us to develop high
frequency trading models and we have spent countless hours with tick data and to
date there has not been any major market anomalies that are tradeable (that we
can find). One approach would be to move away from a quantitative approach
to a more qualitative approach. This strategy would be moving away from
structure to an unstructured approach, move from a counting based system to an
observation (interview) system, act like an insider as opposed to a part time
player, move from the PC data figures and into the market (ie the market may
have language), and instead of having pre-defined data in advance just
work out the numbers as one goes along the trading day. Further, the
cause-effect would move from looking for causes to one in which causes and
effects could not be distinguished. Finally, you would need a measure of
risk aversion and a time limit for your trades. At this point these are just
rough idea's but if we put effort into them, they could be the basis of highly
profitable strategy. In the equity markets there was a small pullback that
the SP system was able to capture and volatility will continue to rise in the
coming weeks. The bond market displayed more weakness as there was a large
number of issues hitting the market at the same time. Gold remains strong
but the XAU (gold index) remains on a sell and the 650.00 point on gold markets
a temporary top. If are strategies both turn up this week look for a
strong rally to follow.
Jan 21/07 - There are a number of issues with fixed trading
systems, non greater than the human desire to override them and the quest to
optimize. Readers of our site will have noticed two systems - one for the
QQQQ and the other for the SP500. Often they are in contradiction of one
another and the investor needs to chose which one will give the better signal
(choice). It has been our experience to only trade the signals when they
are both pointing in the same direction. If we add in the weekly
volatility then more confusion arises as volatility only has a 65% correlation
with the markets but most of the bull market moves (85%) has occurred in periods
of declining volatility. This week oil remained under pressure and this
has negatively impacted the Canadian Dollar, as Canada's major export is OIL.
The gold market remained in a small uptrend but the XAU remains bullish and we
suspect that the price of gold having topped recently will limit any move in the
XAU. Our equity strategy is to remain bullish and we are attempting to
reconcile differences when more trading systems are used (ie 5 separate
strategies). Readers advice welcome.
Jan 13/07 - It was a great week for the markets as all equity
markets ended much higher. As the 5 day January barometer ended and some
people picked up stocks cheap. Markets are not thinking in terms of
diversification, they are looking for gains from alternate investments.
Some of the emerging markets had problems as Chavez nationalized and the India
and China markets fell back from record highs. Interestingly, these
markets also are large user of Oil that coincidentally had a fall of its own.
Whether this is a correlation or causation remains to be seen. Market
volatility remains at low levels but may get some help in April with the SEC
approving changes over at the CBOE that will allow trades to become
leveraged with the help of options. It will certainly get the options
market heated and drive some volatility into the markets. This is
important because it will change investor trading behavior and we feel some
trading systems will stop working and others will improve in performance.
Trading continues to be all about leverage, if it is offered then traders will
use it esp. with the current environment of low volatility. We expect
volatility has bottomed for now. As the year
starts it appears that interest rates are set to rise for durations over 5 years
and the narrowing of the yield curve continues. Gold has an excellent run
up on Friday of 13.00 dollars and we remain bullish on XAU stocks of which we
prefer Goldcorp(GG) and Iamgold (IAG). We remain surprised as our CRB
strategy has not given a sell signal and our Oil sell came late this time.
Our equity strategies are off to a great start with both the SPX and Nasdaq
long.
Jan 07/07 - Lets start the year on the right foot and look at
what matters in investing RISK - the four letter word that most money managers
would rather not talk about because they think there clients are not
sophisticated enough to understand. The forms that risk comes in all lead to
the fact that in some way it was unexpected. You will hear managers of hedge
funds cover themselves by saying something like " there are storm clouds
gathering on the horizon" but that does not add value except when what you are
really hedging is your opinion. We have access to data other investors use and
we make some of the same expectations as it is important to understand what
others are considering. Over the years our models have proven that they are
able to anticipate changes in volatility and thus have us prepare a defensive
position or establish short positions for more aggressive traders. Risk is akin
to a drivers blind spot, you do not worry about what you do not notice until it
hits you. That is the importance of doing your own research. In the equity
markets traders were changing positions as conflicting information about future
fed moves came in the form of lower employment numbers from ADP and then the
opposite came from the Labor Department on Friday. Job growth is important but
not as important as corporate profits, as no profits then no new hiring. The
Bond Market reacted by ending the week virtually unchanged - it is still making
up its mind even as Bill Gross from Pimco thinks there is room for a full
percentage point off the current level. Over at out Bond Trading Site
www.cmetrader.com commercial paper is
actually signaling higher corporate rates We prefer to let the market act
and we make up our mind along the way from vital changes that are near tem.
Gold sold off for a number of reasons over the past few weeks but at this time
the XAU (Gold Stocks Index) in again on a buy. Click on chart name to the
right for clear viewable charts showing long and short entry positions.
Dec 31/06 - We will not be making any significant market
projections for 2007 as the next 24 hours are difficult to forecast with
reasonable accuracy. However, I will comment that there are two types of
risk in the market - those that are close and those that are in the distant.
If you let your mind wander you will be able to come up with a number of outside
risks, such as the political changes coming to the US Senate, the situation in
Iraq, the value of the US dollar as the world standard, Middle East problems,
etc.... The problem is some of them may evolve to become real problems and
some will just linger the way they have for the last number of years. What
you can not do is base an asset mix on this type of logic. But there are
investors you bet on such outcomes and we can attempt to game them over the
longer period. One type of investor who likes worst possible outcomes are
Gold investors. They buy the metal not as a hedge but as a bet on chaos.
In the short term is where you may attempt to squeeze this type of player as the
metal can fall faster than it rises. In the equity markets near term volatility
remains low but we have sell signals on both the QQQQ and SPX. The 10 year
bond rates are headed higher and the yield curve may soon become flat from
negative. If the earnings announcements are not positive then expect that
earnings have topped out. If this happens we will display our earnings
chart that topped out in early 2000, just as the sharp Nasdaq drop started. Best
wishes to our readers for the new year.
Dec 24/06 - This is a time of reflection and pondering plans
for the future. On needs to tune out the TV and decide what is important
to them and to view the future in an optimistic view as any other view will
freeze out any plans we are making. Life has a way of moving forward, the
move can often be described as random but purpose full for a better life forward
for those who embrace the future. All our equity strategies are on buy
signals for the week ahead. This last week looks like those who wanted to
relieve themselves of the pressure of holding into the new year (bears) sold
into the hands of those with a optimistic outlook. Looking forward to
Santa Claus and a rally by the bulls. Best wishes to you and your
family this holiday season.
Dec 18/06 - In the markets momentum is a force that has been
recognized for some time and that came to investors attention in
Momentum Strategies LKC Chan, N Jegadeesh,
J Lakonishok - The Journal of Finance, 1996. People are in search of some
simple rules to explain market reactions and often times there comes along a
theory to do just that. The above in part was a function of the
environment of the time and the time period over which the study was conducted.
Factors not recognized were trading costs were much higher and people committed
to positions for longer periods and market liquidity was not as we have today.
Even today there are samples of market momentum in small cap securities but the
liquidity factor makes it unavailable to larger traders to take advantage of.
We have read hundreds of papers on the markets and the more we read the more
holes we see in such strategies and the one's that seem to be a market anomaly
quickly disappear as traders take advantage of it. just remember if you
notice a market anomaly to not publish it ( now you know that it gets published
because it most likely is not usable). In Newton's world as in the world
of momentum trading a body in motion stays in motion unless interfered by an
external force or by friction. In the market there is no need for external
force as the markets are able to internally generate their own volatility.
The market volatility has been at rest recently, next week we expect this
condition to reverse as the equity markets may start to head lower. Why
they may head lower is the yield curve is now heading higher and OIL prices are
signaling higher prices. In the bond markets a move in the 10 year yield
above 4.63 will signal lower bond prices. In the gold market the metal has
been on a sell for the last few weeks but the XAU is signaling higher gold stock
prices in the coming weeks. Finally, I think they rally we had recently came
ahead of time in place of the Santa Claus week rally.
Dec 10/06 - Asset diversification is not the hot topic it
once was as the words alpha and beta are now the in words in money management.
I t would appear that assets these days are moving more in synch than the days
of the day traders in the 1990's. In this regard the latest casualty is
hedge funds as there returns as well as even small cap securities move along
side the performance of the SP500. What this means to traders is that
diversification is not giving investors the desired results of lower broader
risk. This of course means that is does not matter what asset group you
own as they will all move as a group. To the doomsayers it means that when
markets drop there will be no place to hide, not even in alpha selling hedge
funds. The doomsayers are just too prevalent in the gold markets these
days and that was why we advised selling gold last week. Further, we
expect market volatility to remain low and even a possible rebound in the Us
dollar in the coming weeks. The qqqq market remains in a long position with the
SP500 in a sell causing us to wonder if the market may be going nowhere fast.
This week we will also be introducing a daily bond trading strategy based on the
returns of the 30 year bond as our readers have been requesting more bond
analysis (based on search engine results coming into
www.cmetrader.com our bond site).
Dec 02/06 -
Asset
Allocation is the major determinate of returns for mutual funds. How
much of the return is attributable to this strategy 40-100%? In a quote
from the paper by Ibbotson and Kaplan "We found
that, on average, about 90 percent of the variability of returns of a typical
fund across time is explained by asset allocation policy". This is one of
the reasons why when markets drop funds need to purchase bonds but it is also a
reason why when stocks rise funds buys bonds. In the first scenario funds
buy bonds to avoid further market volatility and in the second scenario bonds
are purchased to keep an 60/40 allocation of assets. There is no inverse
relationship
between stocks and bonds but there is a strong case for a rolling
relationship or the theory of the Fed model. In either case the above is
partial evidence of herd/flocking behaviors in the markets (the behavior only
helps to explain the market reactions - not the triggers or combinations that
start them). This brings us to month end and the above should help explain
why market participants are in a flurry to shape up their portfolios and often
invest access cash into stocks ( as 401K contributions roll in on a timely
basis) and funds show that your cash is not idle ie. your fund manager is
earning his pay. In the commodity markets Gold along with gold stocks are
now likely to head lower. In the equity markets
the S&P was lower by 0.30% and the QQQQ fell by almost 2%. The bond markets were
the stars as rates continue to fall.
Nov 26/06 - Company profits continue to propel the market
higher, as the number of potential problems continue to pile up. The
problems are numerous such as the takeover of Congress, the Iraq war and the
housing bubble to name a few. The real rates for the housing market have
us convinced that it no longer makes sense to continue to purchase housing
as going forward the volatility has increased. But the profits for corporations
has stabilized according to their stock price movements. In fact, our
volatility indicator is showing a sell on Monday (lower volatility ahead) even
as the bears are warning of low VIX reading as trouble ahead. The commodity
markets continue to show strength with the possible exception of OIL and Gold
(including gold stocks) are the best buys over the next few weeks. The
gold markets are helped by an up move in stocks and not by bear markets.
Further, market shorts may be establishing new short positions and that needs to
be reduced prior to any sharp market drops. In the equity markets the QQQQ
remains on a sell as the SPX (SPY) remains the better buy. For investors,
it may not be wise to take short positions due to the higher risks and as
markets have an upward bias over the longer terms. On the bond markets,
lower rates are cause for concern in the US dollar and bonds remain a buy on the
10 year bond on any rates below 4.65% .
Nov 18/06 - High frequency trading is the use by managers of
minute to minute data to find a statistical advantage over the competition.
Most of the competitors in this game are hedge funds and proprietary desks at
major brokerage firms. It is difficult to access the returns on such strategies
but it is fair to assume that because of the shortened time frame in use that
the trades are highly leveraged. Some of these firms may have discovered
anomalies that allow them to take advantage of their competitors weakness such
as limited capital, algorithm trading patterns unearthed, or simply luck.
In the field of high frequency trading, random walk is at home as can be
expected so why do these firms exert such effort and time to find a tradable
system/strategy. We would suggest that each firm by itself is too small to
account for major moves in the market, but if most firms behave in a similar
fashion then there may be some underlying strategy that may prove profitable.
One of the ideas that has been of interest to us lately is how traders view risk
and the time allowed in trades. As the risk has a limit as does time then
traders risk is a moving target that gets bigger as time moves forward. It
is when the time horizons overlap that opportunity may become available -
traders all act in concert. This is best displayed by the recent rally as
trading times collided with bigger risk (lower volatility). Anticipating
the reactions between groups of traders offers the best opportunity to profit
that we are aware of. In the markets the QQQQ strategy is short and gold
continues to hold in rally mode. As short term rates do not drop the yield
curve is widening as longer term inflation
expectations remain contained. On a final note, our
cot data/charts are showing high levels of small trader bullishness, even as
large traders are reducing positions.
Nov 12/06 - It has not been out intent to be a rehash of the
weeks news, but investors seem to be looking for pages that somehow make sense
of the markets by using the news. Does the news make the markets?
Well if that where the case then it would be the journalist that were the
wizards on wall street. No, sadly it is the news that follows the price
action of stocks. Companies are part of the accomplice in the news story also.
When there is good news to report then there is often a stock run up prior to
the official news ( the news that the company could not hold in and let all
their associates in on) but when the story is sad and not favorable then
all attempts are made at plugging any news leaks for as long as possible (in the
extreme case like Enron). Thus it is like currency traders running around
with news that China plans to diversify its US dollar holdings, this was right
after the election and seems more a political maneuver that policy change.
Come on, you never tell anyone what you are about to do before you do it in the
markets - otherwise the sharks would beat you to the punch. In the markets
there was a short term upmove that most likely has run its course as the QQQQ is
flashing a sell for Monday morning. In the bond markets
short term rates are on course to head higher but
the longer term is less uncertain (currently signaling lower rates). The
Gold market has come back to life as well as the commodity game in general -
look for higher prices soon.
Nov 04/06 - Risk is not just a four letter word, it actually
has meaning in many languages but to big traders it means volatility and time.
Why is time important? Time is the difference between a profit and loss,
it separates the high frequency trader from the long term investor, it makes
options decay, causes future's traders to roll over contracts and it makes
investors nervous when time has not been good to them, there is only so much
time to decide when the margin calls come, and finally as the saying goes "time
is money". We could not have said that better ourselves and how true is
that statement. Most profitable traders have time frames for trades to
prove profitable, those that do not will have time decide their fate for
them. For long term investors time has the benefit of an upward drift in the
markets and a historically 6-8% premium over t-bills. Marketers use time
to mark how well they have done and in this case they chose the time from when
they bottomed. If you have investments you need to make time to review
them as needed, a trader daily and long term investors every few months or
longer. The time for a fed rate cut is gone, the time for higher rates is
emerging. the markets are signaling a sell along with increased
volatility. In time we will also change our stance, or time will force us
out of the game.
Oct 29/06 - The Sharpe ratio is a measure of excessive risk
per unit and risk in the markets is known as volatility. How do we compare
risk/price? These are two separate calculations/idea's and price is a
function of so-called value. Simply, price is what you pay and value is what it
is worth (according to some calculation). The best estimate of value is to know
the prices of a similar security (ie. look at other stocks in the same sector).
There are often a number of unobservable variables that make a difference in how
securities are priced (this is often a function of private information) but in
general the group moves as a whole. In an unknown future any two
securities that will profit equally from similar economic variables should have
similar current prices. The markets quants will attempt to model future economic
situations and thus there work is often centered not on price projection but the
future volatility/variance of a stock or groups of stocks. Thus the future path
of stock may be unknown but it may be possible to estimate a scenario of
possible future prices based on volatility. Thus if two stocks have a
similar future volatility then they should have a similar future prices.
In the markets we have been looking for volatility to rise over the last couple
of weeks. Short term the QQQQ and the SOXX index have least resistance on
the downside along with financial stocks. Financial stocks will take a hit
as short term rates move higher due to pressure on the US dollar. We
suspect that the election will have many court challenges as computerized
counting with no paper trail will leave open the validity of this technology
thus spreading the risk of unknown makeup of the future senate and US policies.
Oct 22/06 - When the average investor decides to buy or sell
a stock they will often be staring at the chart for longer than they would
otherwise. What are they thinking about? Is the chart somehow relaying
them information that they may have previously overlooked? Most likely
they just need some kind of confirmation that they are making the correct
decision and by looking over the chart they can conclude that they had spent the
time needed to make a good decision. Most of our readers will probably
notice that they are viewing the same information as before (a chart) and that a
chart has some value it does not display all the information about a stock.
Other variable to review may be insider trading, earnings potential, upcoming
market launches (new products), personnel changes, partnerships, recent
volatility, market strength etc.. the list is almost endless but we need to work
with information that we believe has value. This list will also change as
the market participation changes - it the 1990's it was the individual investor
who brought momentum back to the markets and after 2000 the hedge funds came
with their quantative methods. You need to have a strategy to deal
with the changing times and individuals. As Keynes said
"When the facts change, I change my mind. What do you
do, sir? The
markets this week were confused as the nasdaq declined and the S&P 500 posted a
small gain. Volatility came to new lows even as we have been expecting a jump in
volatility over the last week. In the bond markets any move to the upside
(greater than 0.05 ) by short term rates will signal a jump for t-bills up into
the 6% range. Inflation seems to have come under control and thus it would
appear that short or long rates have to logical reason to rise. Just as
when we are reviewing a chart, we are missing a lot of the picture.
Oct 15/06 - The valuing of a public company is difficult work
and often times even the CEO is unable to value their own company. When
analyst attempt the same they do no have access to the private info that the CEO
has, thus their estimates will likely fall where others that have come before
them have fallen. Our work is not to place a fundamental value on a company,
only if there are likely to show increased profits and if they company is
showing faith in itself by buying back its own stock. Over the last few
weeks many companies have done or announced both. The other part of an
investment strategy is the holding period one is willing to wait to see a profit
on your investments, a week is probably too short and forever is a long time to
wait. In the end it will depend on the investor and how long they have
been investing, new investors are likely to get nervous soon and the battle
hardy will have seen it all before. Another method of your time horizon may be
how one responds to market feedback - do you monitor your stocks inter-day,
daily or weekly. We are currently involved in working on a strategy that
trades about 6-10 times a year and is focused on stock selection, unlike the
charts that we have been posting on our site. The markets showed good strength
this week with the exception of a small plane hitting a building ( a small event
caused a large disruption in the markets) but they quickly recovered, plus some.
The important development this week was higher interest rates (esp the 10 year
rates), in the shorter term the 3 month commercial paper is close (if they move
10 basis point higher) to busting a new move higher.
Oct 9/06 - In the markets information and how one processes
that information are known as the information ratio. One has to be able to
produce high returns relative to the volatility of the strategy and this is
often why investors prefer a 60/40 stock-bond mix. Some have even suggested that
stocks are lower quality bonds with no repayment date. This may have been
the school of thought prior to the 1990's as the dividend and dividend ratio
played a major role in investment theories. Things change and we are
constantly on the lookout for small and major possible changes to the economy
and investor appetite. This week will likely mark the low end of the
volatility for the index markets ( with or without the North Korea test) as
window dressing season is over and the US political scene heats up. The QQQQ
looks to sell-off but the larger caps may continue to higher ground.
OCT 01/06 - The trader and the quant coming soon to a
brokerage house near you. It is expected that discount brokerage firms
will soon make available to retail clients trading strategies that were once the
domain of hedge funds. Will this be too much power in many hands or is
this a way to extend the life of failing strategies? What we do know is
that when in the late 1980's when technical indicators became standard on we
sites and easy to calculate on home PC's , that was the end of any remaining
value to technical analysis. The success of technical analysis was that is
was so easy a monkey could do it, one could argue that the quant systems now
becoming widely available will come complete with order placement. You
just need to select the system that works for you (this says little of the
system continuing to work). This may be a blessing to people who
understand how these systems function. TD ameritrade may start rolling out
this plan next month, Fidelity offers its WealthLab Pro Software, and
Interactive brokers offers advanced order placement strategies. For all these
brokers it will mean more trading and commissions in the long run ( people need
ideas to trade, even if they come from older hedge fund idea's). The
market this week displayed good upside and market volatility
continued to stay at low levels. The next week should be more of the
same as the QQQQ market should outperform the S&P
500. In the bond market bulls are running
the show with pessimists looking for a slowing economy.
Sept 24/06 - The Risk - as this week highlighted the Risk in
Model/Correlation trading and hedge funds that fail to diversify and what
happened at Amaranth. I will not go into the detail over at Amaranth but it is
fair to conclude that the risk was not contained. One of the core issues is that
risk advisers are aware of the type of risk their traders are engaging in. For
example they only hire risk managers who understand trading and global markets,
they can build, stress test and back test models, understand the trades placed
by their traders, are forward looking and keep an eye on these forward risks.
But how is it possible to keep a lookout on these forward risks if the forward
risks are uncertain. The risk manager will tell you they have their own risk
models (ie VAR) and understand the volatile nature of the markets. This is
essentially a catch 22 as the risk is known to most and those willing to accept
the risks will place the trades. Secondly, and much more important is that the
volatility often makes the price of an asset a highly unreliable function of
value. It appears the US dollar as a store of value may once again be in
question as lower rates prompt many to seek higher yields elsewhere and in other
currencies such as the Euro Dollar or
British Pound. Even as the equity markets ended lower
this week our models continue to forecast higher prices in the near term for
big cap stocks, the small cap stocks may be
moving in the other direction as witnessed by the
Russell2000 trading strategy. In
the bond markets the 10 year rates may be
dropping as some investors move out of housing related debt and into the secure
arms of federal debt.
Sept 17/06 - The markets are about business not politics, but
the politics of business interfere in the markets. This week oil prices
began a steady slide after the OPEC meeting last weekend and on reports of
Iran's willingness to possibly suspend any nuclear enrichment. However,
the bigger story not published was of states such as Saudi Arabia willing to
pump oil as needed and thus keeping inflation levels contained and not becoming
a factor in the coming congress elections. These are the types of items
that are difficult (impossible) to build into quant models. As per last we
continue to see lower "market volatility" and more market
surprises to the upside. As we approach
month end window dressing will pick up and corporate earnings continue to remain
strong. The Canadian markets are
dropping as as result of lower gold and oil prices but there was news this week
also of lower productivity levels. The
bond markets continue to show good strength as the inverted
yield curve looks to possibly start moving back to
a flat level in the coming month.
Sept 10/06 - The markets are composed of group's of
traders but they are not the sum of their parts. In studying behavioral
finance we have found it to place too much emphasis on how individuals act under
certain conditions. Most experiments are often carried out not in real
world conditions, but on university students who may act in an manner that is
expected of them. In the markets people carry out sentimental studies of
who is bearish and who is bullish and these studies at best are coincident
indicators. But people who are promoting such strategies will point to
such and such at time that the gains were strong or when you may have been out
of the market and missed a market decline. Market decisions are made based
on incomplete information ( much different than how we make other decisions) and
decisions are based on what others intend on doing (they are also awaiting your
decision). In the market, individual tendencies do not carry forward to group
behavior. In the commodity markets both oil and gold came under heavy selling
pressure as investors in those commodities gave up their middle east tension
premium. The market premium (as measured by the VIX)
is also due to drop in the coming weeks and thus the likelihood of
rising equity markets. The biggest
development this week would have to be a buy signal by the "yield
curve strategy". What this means to either short or long term rates
remains unknown at this time except that long term rates are closer to a bottom
than a top.
Sept 03/06 - The rational trader most likely does not exist,
among the general public that is, as institutions have implemented trading
strategies that remove the trader out of the equation. Trading rational is
difficult as we face pressures within ourselves that cause one to react to
market noise. Trading on fundamentals may be one of the better strategies
but investors know that prices often sway one way or another from the
fundamental value ( we are not sure how to value the markets in this manner as
even the future stream of company earnings is unknown past the next six months).
There has been much ado recently to inject physics into trading as particles
also behave in a random fashion but there are mathematical ways to measure their
movements and ranges. One of the drawbacks from this theory is that atoms
behave as atoms but people do not behave the same way in similar occasions.
People have till the last minute to make up their mind, and often that is when
they make a decision. All the talk of rational trader is often at a dead
end due to all the conflicting evidence and the high level of noise in
individual decision making. Our tendency is to focus on groups as there
will always be average behavior and we can expect traders to do as there
neighbors as birds do in a flock (ie flocking). Since not one trader
determines market direction the herd instincts are better studies for changes.
This week the markets had a good run-up in both
equity and
bond markets. The oil market came
down as the political premium dropped out of the price but we still see a rising
tend. The GOLD strategy continues to forecast higher metal and XAU
stock prices. Finally, the rational traders seem to have driven
volatility down to levels not seen for some time even as
the worst months to be invested comes upon us.
Aug 27/06 - It is the last week/new month and this is the
optimal time to be fully invested. This is due to a number of factors but
the biggest is mutual funds putting new money coming in into the markets and
some increased buying of the stocks they already own. The
yield curve may be signaling a coming slowdown but this often leads the
economy by about 3-5 quarters. The value of the yield curve is the expected
change in short term rates - as falling short term rates indicate slower real
GDP. Further, at the end of an economic expansion long rates often fall as
the decreased volatility in rates warrants a change in risk premium. This
is interesting a current market volatility remains below historical norms and is
signaling a lower volatility starting Monday until the
next signal. Along with this we have a bullish
S&P 500 index even as there is much reason to worry about the middle east
and rising protectionism. Do people feel the worst is over in the world
political scene, are people starting to feel confidence as the start of student
spending, are corporate earnings about to rise in general or are investors just
becoming too complacent?
Aug 19/06 - The market are a place for taking risks but we
often take bigger risks than we need to. Most people are often not even
aware of the type of risk that they are dealing with so let me begin with a
small list: equity risk, duration risk, yield curve risk, liquidity risk,
credit risk and volatility risk (to an extent even fraud such as has been
witnessed with Enron). If the market is about who has the best information then
we must define what type of information once is referring to and how does one
quantify the correlations. The customer is only concerned with the bottom
line, thus fund managers carefully monitor their volatility in relation to their
customer appetite for risk. Many customers may want risk but they will
move their funds when their account has been running a deficit in comparison to
the benchmark. Stock and bonds do have common features and it has often
been stated the distressed debt trades just as volatile as the common stock.
A few things to keep in mind when comparing the two: stocks have unlimited
upside, both may pay a yield ( dividend vs coupon), its just that stock do not
have a maturity date - thus often the overextended P/E ratio's. The Nasdaq
had its best week and volatility fell to a new recent low, the momentum of
small cap stocks remains strong. Finally,
the yield curve (often considered a
leading economic indicator) remains in negative territory. It has been
suggested that this is a harbinger of a recession and a downturn in the business
cycle. It is of our opinion that
short term rates will be
heading lower as the Fed is foreseeing slowing consumer consumption due to
the housing construction (read sales) slowdown that continues to suppress
lumber prices.
Aug 05/06 - It looks as the Fed will pause, we are issuing
our first sell signal on
commercial paper since our last buy in early 2004. It would appear that the
Fed is aware that the economy is weakening and does not want to tip the US into
a recession. The housing market is the talk of the economy as it has
driven both job growth and consumer spending. Most of the housing gains
can be traced to Real Interest
rates as calculated by yield on 3 month t-bills less the rate of inflation.
Since approx. 2002 until the start of this year the real rate has been negative
thus encouraging speculators to borrow funds and invest in real assets.
Assets were in effect rising faster than interest rates, thus the risk is
reduced for investors. However, as the rate is now positive (but below
historical standards) we are seeing a drastic slowdown is new home sales and
will likely see foreclosure notices also on the rise, as property values
increased the banks were willing to extend credit thus delaying any
foreclosures. However, if the Fed pauses here we will see inflation in the
form of a lower US dollar (higher import prices) and after an initial mini rally
in bonds an eventual sell-off. If the Fed does not act as expected we will
witness a sharp increase in investor fear (aka the VIX).
July 29/06 - If cash is King then mutual funds are holding a
lot of cash these days, but after the run up this week I suspect the cash levels
have dropped. Why hold cash and is it not a contrarian indicator?
Cash is normally held by open end funds to pay expenses and investor
redemptions. In time of high rates, such as today with T-bill rates in the
5% range it offers an alternative to the market. Some of these managers
may however be attempting to time the markets when in fact investors pay them to
select stocks, if they wanted to time investments they would buy a hedge fund.
Fund managers ( and those selling funds) should heed their own advise that
missing the 5 biggest days (by not being fully invested) will reduce long run
returns by X percent (to really put fear into you some may say up to 50%). With
this weeks big up move the markets have again become complacent - or are they
building into the market that the Fed will pause on rate hikes come Aug 08.
Remember, last time the rally started immediately after the Fed hinted a
possible pause and this time investors wanted to jump the gun. The problem
with this is that earnings have not kept up with expectations esp. with tech
stocks such as amazon and yahoo. Expect upside
volatility over the coming weeks, which most often implies
lower markets.
July 22/06 - One day the Bernakie of the Fed speaks and
investors hope onto the bull train before it is too late. It would appear
those who got on also got out the next day at the same price in the belief that
the rally was now over and we should just wait for the next fed hearings. The
markets may rally back as the sidelines are plump with cash as investors have
been very gloomy as of late. Two important variable that should be considered
about market risk is the yield curve spread and market (VIX) volatility.
The yield curve is indicating that it is going to be a tough environment for
financials (banks) to make easy profits off interest rate spreads and the
volatility is indicating that the bears may have gotten ahead of themselves.
The two factors also account for Keynes expectations of stocks in the form of
enterprise (asset yields) and investor speculation ( as in forecasting what
other investors believe). It is only in the short term that emotions play
a critical role ( is Microsoft really worth 100 million more in one day).
The 10 year bonds appear to want to stay in the 5% range until the next
Fed meeting or further inflation numbers come forth hinting the state of the
economy. The markets want to head higher but not till the weak hands have
been shaken out and big investors jump in, afraid that they will under-perform
their peers.
July 16/06 - Things just got a lot more difficult to place
probabilities on the market direction as Middle East tensions (war) has now
entered the picture. The news will keep this issue in the investor's
attention thus most likely freezing retail investor activity. Investors
will however flock to the new haven, OIL. Along with oil , GOLD and the
CRB index point to higher commodity prices and that means higher gas prices as
the pump. This in the end means less for the consumer to spend on
discretionary items. Markets are in the short term ruled by chance, and in war
the chance of things changing rapidly due to small events in enormous. As
weak as the market appears, the VIX index appears to be making a short term high
on Monday July 17/06. This would be confirmed by a move of the Russell
2000 index above the 690 level. On the 10 year bond index the near term
critical level is 5.04% . Previously we had mentioned that the yield curve
might be headed higher, we were wrong. On a final note, the winners of war
are the suppliers of weapons, and today the biggest supplier's are the members
of the UN security council - interesting.
July 09/06 -
Inflation seems to have been the topic of the week as the volatile ADP
figures showed a higher than expected jobs growth. When the official stats
fro the Fed came out Friday they showed a strong growth in yoy earnings and an
increased overtime work. This would suggest that consumers will be able to
meet higher credit obligations and employers are delaying new hiring as the Fed
signals it wants a slowdown in the economy (soft landing). The
ECB delayed increasing rates and this gave a reprieve
to a weak US dollar, but they have hinted of higher
rates in the coming months. Further, the Japanese will raise rates soon and this
will remove the free money available for taking ever
increasing risk - as witnessed by the volatile emerging markets in May 2006.
One notable item this week was as the US dollar is a harbinger in times of
political turmoil the the USD actually dropped from June 30 of 85.23 to July 7
of 84.96 and 30 year bonds remained flat. It would appear that political
problems are a plus to world oil prices (the new reality). The small cap
Russell 2000 index remains in the sell
zone with potential for further market rally above the 720 mark.
July 01/06 - Market volatility moved swiftly to the downside
but these times of faster moving volatility indicate future
volatility. Along with the swift changes comes a widening in credit
spreads as witnessed by higher
commercial paper
rates against lower treasury bond rates. Over the longer term the business
the term premium can
help predict market return variance and future economic activity, thus the vast
amount of time and resources spend on predicting the yield curve. Another
are to watch will be consumption, as investors will consume less if they believe
their future returns will be low. However, as consumption is a lagging factor it
is difficult to model. The Fed once again moved in a predictable manner
even as the press was pushing for a possible .50 point rate increase in the Fed
rate. This expectation set the the mode for the 200 point plus rally on
Thursday. A rally that is not built on solid fundamentals is likely to see
a reversal over the next month. The market is overvalued in the short term as
our S&P strategy is in a sell mode and
volatility will move higher over the coming weeks. Gold was not impressed by the
Fed as rallied over 20 dollars (we missed this rally) but our models have
signaled a buy on Gold for Monday morning.
Further, the CRB index is also in rally mode
starting Monday, this came as a surprise to us but considering the Fed is
waiting fro signs of inflation - well those will be
forthcoming soon now that the USD is once again heading
lower.
June 24/06 - The Fed is set to
raise rates again next week, and bonds
adjusted accordingly this week. The 10 year rates have risen for the last
straight eight trading days to 5.23%, an increase of 27 basis points over those
days. The volatility in the markets is now spreading to bonds, the most
sensitive being corporate bonds. There may be technical buyers at this
level early next week but the trend is your friend in this case. Speculation is
also gathering that there may be a 0.50 percent increase as the new Fed needs to
break the predictable mood or risk being told by bond traders of their next
move. As oil prices are headed higher into
the hot summer the rate of inflation is not likely to drop in the near term.
Further, price hikes often take up to a year to filter into the retail level as
companies have existing agreements in place to protect them from supply and
price changes. This week also was the into of two new etf's from powersahres for
trading the retail nasdaq market,
QQQ Proshares-QLD and the Short
QQQ proshares -PSQ. They
claim to move twice as much as the underlying index but they have liquidity
problems at this point. Gold continues to be weak
and the entire CRB index appears to be heading
lower as recent speculation is beginning to draw up with redemptions at hedge
funds.
June 17/06 - Volatility is back in play but hedge funds are
showing negative returns while complaining since the start of the year that low
volatility is causing low returns. Let see, what do they want - what the
rest of the investing public wants - a rising market. Cause is something
that often happens and it is anticipated based on statistics to happen again
hopefully with consistency. Funds (including hedge and institutional
funds) follow certain laws, the most important of them being to keep their jobs,
having to satisfy their banker and to have returns with low drawdowns (ie
volatility). Most managers today have had no experience with either a bear
market or market volatility. Our most likely scenario is going to be
higher energy (OIL) prices in an environment of
lower commodity prices. Further, the
yield curve is turning higher as
short term rates are
moving higher as signalled by the Fed and company, thus the implication would be
higher long term rates.
Recent speeches by Fed members has almost a beyond our control tone (on
inflation), this we feel does not send a message of
confidence to the public.
June 10/06 - The yield curve has inverted, Ben Bernakie's
credit is in doubt, gold bugs are on the run but
the market is set to Rally. Yes, we are
expecting volatility to fall this week and market players
such as asset allocation managers to move funds into stocks. By the end of
the month the Fed will not have even a more substantial
strange yield curve to deal with as
recent liquidity being pumped into the market will have undesirable effects.
Inflation should continue to rise but the commodity
rally seems to be over with the exception of perhaps OIL. On the world
currency market, Ben will step up to the plate and we are about to once again
see the flight to quality even with all the negative press written about the
US dollar (do not believe it). With the strong
US dollar and falling metal prices the
Canadian markets will likely continue
their downward trend.
June 03/06 - The big question is will the Fed raise rates or
will they take a pause as that is what Wall Street is betting on. There
have been 16 consecutive increases by the fed since June 2004 and they have
hinted that any future increases are data dependent. The one thing all fed
members can agree upon is the containment of inflation - but this is impacted by
energy prices but also other factors such as the weak US
Dollar (and the rising Chinese currency that is not often mentioned in the
news these days). The action of the
10 year bonds to the 5%
area is again concern for the Fed as the yield curve is flatter and the
conculdrum is in replay. We expect the Fed to take action in getting the curve
to its natural state and the foreigners will take advantage of strong
bond prices to take some funds out of the
USD. If the govenors are as data dependent as we are led to believe then there
will be a credibility issue and we hope Ben will not speak unofficially to Maria
again ( she spooked the market the last time). As the major completion of
the three gorges dam in China is complete we are expecting
commodity prices to weaken in the coming months and
GOLD is flashing a sell for Monday morning. we
expect market volatility to remain in its recent range or
less in the coming week. In a final note the weaker housing market is
beginning to impact the random lumber market as
it finally dropped below the 300 mark.
May 28/06 -
Language of Speech and the Language of Markets pdf. This is an early attempt
to comprehend if the markets do in fact have a language that can override the
market noise. For a complete picture of information theory see works by
Claude Elwood Shannon
on www.wikipedia.org . This is a very
interesting field but difficult to apply to the markets, but some such as
Jim Simons of
Rentec
have been rumored to applying such theories to the futures market. We will be
posting a daily ES Emini (SP 500) trading strategy on the S&P that places trades
overnight when uncertainty is high.
May 21/06 - The market once again continued to fall and the
specter of 1987 raised its head. Some may feel there is a lack of liquidity in
the markets but most liquidity players are of the short term nature.
Liquidity traders talk of the bid-ask spread and the availability of market
depth, well any experienced trader knows this changes from day to day and week
to week. It is of our opinion that illiquidity bursts happen frequently but have
much shorter durations than the other market variable - volatility. In the
current unstable market players will switch strategies that will lead to
market stability thus the switch that is happening is the cause of the current
market liquidity issues. Our VIX strategy is highly
adaptive to this type of regime and has issued a second sell on volatility
(should move lower over the week). The other markets on sell include the
gold XAU stocks which has fallen from the 170
area to 140. The commodity markets including
oil seem to be topping out and may be overextended
due to momentum strategy players (we expect the players to also change
strategy). The current run to safety in the form of
10 year treasury bonds seems to put a cap
on rates over the next few weeks. Fed talk today rules the market, Snow
and fellow treasury Fed members are only too happy to provide optimistic
guidance (would you expect anything else).
May 14/06 - Is was a week not to be in the markets, including
equities and
bonds with the exception of
GOLD. Our only warning of impeding danger
was an expected rise in volatility according to the VIX index. Those at our site
early this week would have noticed the flashing volatility warning.
Interestingly the volatility index is showing a slowdown in VIX in the coming
week (please check back Monday on this link) and NYSE new
52 week highs is also currently at only 29 and we are forecasting any close
below 28 to be a good buy signal (we do not post this chart for proprietary
reasons). Commodities are a brand new game and we are showing that a top
is imminent and traders should start lightening their positions. As oil and gas
prices continue higher some counties have decided that they own the resources
and they will be taking them back from corporations free of charge. This
is going to change the rules and the political response will be interesting.
The chase for gold does not extent to gold stocks such as
the XAU index due to the changing in the
commodity game. In the currency markets the US dollar is having problems find
support against the Yen. Further as China was not
named as a currency manipulator by the Fed it will remain interesting to watch
future political developments as this is the first time in recent history that a
pegged currency is being used to help finance a debtor nation.
May 06/06 - Are expectations different than predictions, we
thin not but is sounds better. Market participants can not operate in a vacuum
and must take into account the thinking of others. The group with the
greatest mojo is the public, just look a what is happening to
GOLD. Sometimes it is not so smart to be a
contrarian, like a train a full speed you will just get trampled but is does not
hurt to hedge yourself using the XAU index.
The models taht the public use are well chaotic and not open to modelling as
they will disperse as fast as they came. In the bond markets we are looking for
a widening in rates due to credit quality (ie mortgage rates may rise faster
than the treasury yields). The logic for this widening is likely to for a
multifold of reasons, among them is the weakening US dollar - just look at the
recent strength of the Yen, Euro
or Pound. One of the reasons for the weaker US
dollar is that if China is going to peg its currency than traders are going make
the adjustment with tools available to them. Our
CRB index continues to flash a warning sign, it is time to lighten up or
even short commodities.
April 29/06 - The week was marked by Ben Bernake's speech
about a possible pause in the rates hikes by the Fed. This option is
likely to create further uncertainty in the markets about the true way the fed
is heading and in turn cause further volatility in the
bond markets. If by this
conclusion we are lead to believe the fed will be swayed by current data, then
we will likely experience larger moves on days of economic data releases or the
alternate view (and valid) is that the policy is to lower the US Dollar. Please
see charts on foreign currencies Euro,
Yen and the Pound. There
are two types of risk in the markets - market and credit risk. With credit
risk to your ability to contain inflation and preserve the value of your
currency or market risk of liquidity available for corporate/treasury funding
which experienced weak bid to cover ratio's in the last week. If the state
of excess liquidity dries up (decrease) there will be undue risk exposure for
long term debt holders. In equities the poor numbers from Microsoft sent
the stock tumbling 11% (in a
single day), whoever said MSFT was a boring stock. The market action of
MSFT shows how investors compare recent returns of similar stock in the sector
and create expectations based not on company projections but comparisons to
hot stocks (in this case GOOG). The commodity
markets are racing ahead with Gold once again
leading the pack. A new ETF for
silver in now trading under the symbol SLV.
April 22/06 - The commodity markets
are were everyone wants to be these days. No more is this apparent than in
the market capitalization of
the Chicago Mercantile Exchange. They will also start to carry options on oil
for the Nymex. Oil this week was at the forefront of economic and general
news as it topped 75.00 per barrel and gas at the local station was close to
3.00 per gallon. Our statistical Oil trading
strategy is currently on a buy signal from around the 65.00 per barrel
level. You do not need to be a futures trader to play the oil game as an oil etf
is available under the symbol USO.
You will have no liquidity problem with this problem as there are over 1M shares
traded daily. Gold continues to be HOT and
we now expect the XAU to also rally faster. In
the equity markets, things are about to get shaken around as
near term volatility is set to rise. This is perhaps our best measure
of risk, as volatility is the risk in an investment. Two of the biggest
reasons for a possible rising VIX are rising
interest rates and the impact of inflation (oil)
on consumer credit. In the bond market we expect the yield curve to continue
rising slowly as short term rates may take a breather. The possible impact
of rising volatility is a widening of credit spreads as earnings become more
difficult to forecast.
April 16/06 - The market can be characterized as three types
of expected returns: the risk free rate (such as t-bills), risk premium of the
market that is inherit in index funds, and alpha - the type of return from
assets that are uncorrelated with the markets. Excess return compared to the
benchmark is the alpha, and today's investor expects good returns with little
risk. Some investors are likely to believe that sophisticated funds, such as
hedge funds, with complex mathematical formula's may deliver such returns. Hedge
funds like other funds tend to invest in too narrow a field to deliver high
alpha on a long term basis. If these managers do have skill, it is
the skill to profit from the mistakes of other funds. One of the reasons
we suggest this is because 60-70% of the daily NYSE volume is from institutional
traders (trading with each other). As we have alluded to in the past, the market
is not about being the smartest but able to benefit from the mistakes of others
(almost a zero sum game). The market continued in its holding pattern, the
10 year bonds broke above the 5.00%
barrier and gold is still HOT. We are not as
optimistic on gold stocks as
commodities (not the stocks) are in demand, esp
with oil due to unrest in the middle east. One
chart that we do not post but would like to mention are utilities, we believe
they are headed for a long fall from current levels due to the most part of a
rising yield curve and higher long term rates (
rates, yield curve and inflation are now part of the site
www.cmetrader.com )
April 09/06 - The bond markets are talking and investors are
now on board for a possible bear market in
bonds for the remainder of the year. How is that possible? One of the
reasons is the attempt by the Federal Reserve to keep
inflation contained. The reason to keep inflation low are multifold
including pensions that are market to inflation, federal payroll, and keeping
interest payments to a minimum on future debt. The
GOLD market remains HOT but gold stocks
seem to be a sell at current prices. Oil prices
will put a punch back into inflation as will a HOT economy. This however
represents a dilemma for policy makers to keep perform a delicate balancing act
between a strong currency and low unemployment.
Commodity prices remain firm with low
copper taking the lead.
On the markets there continues to be a low VIX reading
suggesting limited downside potential. On a final note we would like to inform
our readers that the Hot Stocks trading strategy is aimed at small cap and micro
cap securities or lower priced securities such as Nortel Networks.
April 01/06 - The markets were good this week as the S&P is
once again hitting the 1300 range. The asset allocator's are sitting up and
taking notice, move out of bonds and into stocks as we have done over the last
few weeks. Even the bond king at www.pimco.com
is asking his investors to be patient as they move away from indexing and into
less liquid bonds and in some cases they are dominated in foreign currencies. As
we have stated over the last 2 months, bond
rates are moving higher. Even corporate bond
rates issued a sell this week, this i index is composed of equal weights
along the time horizon. It is our opinion however that long rates will move
faster, evidence of this can be found in the yield
curve. As bond move higher, the USD may suffer as funds move into
Euroland. On the commodity front the
CRB index moves higher thanks to oil (an oil ETF
will be available on AMEX this week). As stated last week the
VIX continues to stay low, thus limiting any downside
market moves (based on probability).
Mar 25/06 - The markets are continuing to show low
volatility, is this due to investors becoming complacent. The VIX is the implied
volatility of the S&P 500 index and is at multi year lows. Some have argued that
the introduction of hedge funds and derivatives have allowed institutional firms
to sell off risk to others willing to accept it, thus lowering risk premiums. We
have attempted to model the VIX, the results appear to be reasonable and when we
test it on the S&P index it showed that profits were made on a declining
volatility index as when the index increased there was a small opportunity to
make some profit on the short side. In fact over the last 10 years there has
only been a 20% chance of losing any money after a sell on the VIX, indicating
lower volatility levels. The recent Fed tightening may in the near future
induce lower liquidity and thus permanently higher VIX levels. Another factor
often not referenced with the VIX is corporate earnings, as earnings estimates
get further off the mark of analysts expectations the VIX moves higher.
This often finds its way into the bond market as spreads between the
corporate and treasury bonds will widen, making it more difficult for lower
quality (small firms) to raise funds.
Mar 18/06 - The market continues to climb the wall of worry,
as inflation remains tame and rates continue to be a central point. Area's
of risk increase as investors have different measurement styles, some investors
compare the risk premium to t-bills and others compare them to
T-bonds. I
guess the differences will arise from one's investment horizon, but today
results are measured from quarter to quarter and if the numbers are too under
benchmarks, money will look for a new fund to call home. Our analysis show the
yield curve is the best correlation for market premiums. As it combines
both long term and short term investors its time frame it today (and the near
future). As we move along the time continuum the premium continues to be
updated, and new expectations need to be measured. In the Gold Stocks we
are bearish as the XAU continues to be weak and there may be funds flowing out
of gold as oil rich countries act to prop up their markets. Further,
political moves between the US and China will be played out by senators on their
visit to china regarding currency manipulation and the possible passage of a
bill for a 27% tariff on products from China. Whether this is a political
move / a way to get votes remains to be seen. Evidence however can be
found in the markets if one knows where to look. Political analysis is not our
main focus, just risk one needs to keep in mind. Just like when countries come
out about policy changes or clarification regarding currency policy.
Mar 12/06 - The markets continue to trade in a sideways
market as the interest rate markets are attempting to work themselves out. The
yield curve may start turning around this week as we see
higher long term rates ahead along with a stronger
US dollar. The reason for this is that no market
works in isolation and all markets are tied together in a sense. However,
in a rolling correlation study by Bridgewater Associates they showed the two
were linked over time and need not be connected on a day to day basis. Thinking
about this deductively if rates are moving higher then they are attracting
capital that is converted into US funds, thus increasing the demand for the USD.
Taking this logic to the next level, markets are also not only tied to one
another but to government and exchange regulations, the availability of stock ie
new issues and buy backs, linking to an index (ie S&P stocks have been shown to
have lower volatility), availability of funds (such as the money growth), risk
of alternate assets (such as art, gold), and countless others. One must
decide which are important and which can lead to confusion and noise trading
(trading on causation and gut feelings). As we do not want to give information
only to those who have emailed us regarding rates, the following link will take
readers to our 10 year bond/ usd
index for your own analysis.
Mar 02/06 - The current state of the S&P 500 rallying to new
highs is being driven by liquidity. Liquidity is the maker of asset
bubbles and the main driver is the economy. The economy in turn is the
driver of credit availability and interest rates. The other variable in
this formula is the productivity factor and I will leave the rest up to our
readers to determine. What we would add is that no one factor is the driving
force of the markets or the economy. This leads us to our next important issue -
stock picking and asset allocation. Sock pricing is the losers game but playing
the averages such as with the HOT STOCK strategy can
give us the edge. That edge is very thin and is dependent on being long
during periods of liquidity and rising markets. Just like being at a
casino and betting it all is not prudent, in the markets the losers make the
same type of bet. In the markets we remain
bullish on stocks and bearish on bonds. Bonds
are now returning to a period of increased volatility and people holding for
income may be getting the short end of the stick. Further, we see an
increase in inflation and a rise in bullion prices
(strategy long coming Monday) but the XAU index
conversely issued a sell for Monday. This may seem perplexing but the
factors that move one are not exactly the same factors that move the other.
Feb 26/06 - It was a relativity unremarkable week marked by a
decrease in volatility but we believe bond volatility is
about to pick up. The situation with the current state of the yield
curve is making it difficult to forecast returns
both on the equity and bond markets. Interest rate expectations play an
important role in future demand for funds and inflation
expectations. Monetary policy may dampen real interest
rates and thus future production. There has been much published information
on the yield curve (eg Estrella 2005) for us to comment further and some are
even suggesting the presidential cycle has slide into a normally downward part
of the trend. Do president's matter as much as before? time will tell. Our
asset allocation models continue to favor
equities and to continue to unload GOLD
positions as the US dollar is about to gain strength on
the back of increasing US rates. In a final remark
some of our readers may be finding the QQQQ timing
system a little boring but the fact remains that it is better to be long for
longer periods of time due to a upward market drift over time.
Feb 12/06 - The answers to the markets are wide ranging but
the only one's that matter are the one's that bring home the money. Market
data is dissected by the hedge funds such as DE Shaw or Jim Simons of Renaissance
to find where there algorithms can give them an edge. They have at their
disposal a lot or mathematical models, PhD's, computing power and data that they
create in-house. This is what Wall Street wants us to think. Just hand over your
money to the funds, you have no chance of competing. We for one think this
is also a good idea as it hands money to persons who have strategies that we may
understand. Just as some of our strategies are used to profit from technical and
trend traders others are designed to profit from the so called fund masters. The
biggest individual stock news this week was Google (GOOG) but some of our
readers have caught onto the hot stock strategy
and were able to avoid the carnage. On the macro FX world the US Dollar looks to
make a comeback as rates have risen enough to bring the money back home.
This is just slightly behind our sell on the gold stocks (XAU). Often our
signals our early but we prefer that to leaving the party late as liquidity
dries up and the fill you get is not the one you expected. The
yield curve traders are now having system problems
as there models are not robust enough to work in an inverted yield world, thus
one of the reasons for the recent volatility. Finally, in tune with our last
commentary the bond market is going to heat up this
month with rates heading north fast.
Feb 05/06 - The value of the market is in the risk-premium.
Just think of this, when you sell your securities you are transferring your
risk onto another individual for a given price. When we are developing models we
take into consideration investor risk preference which will vary from large cap,
small cap, gold stocks, or the bond market. Of all these categories the
gold stock have the most risk premium as these investors are going for the gold
(or bust). The risk adverse are in the bond markets but they are also the most
sophisticated. One risk that we can not hedge away is that asset classes
influence one another. On this point the Fed has been making smaller moves
as the VIX has dropped to record lows. As the VIX
has started to trend back up over the last three weeks corporate earnings have
increased in volatility. Is is really a coincidence that the two have
moved up together? Portfolio's need to only change as the economic environment
changes, such as will be the case for 2006. The bond
markets appear to want to push rates higher, as the new 30 year issue next
week is likely to test the appetite of bond traders. Further, this is the
year that much junk bond is up for renewal and the business environment is
signaling a less willingness for such low risk premiums. We believe
February will reveal the direction of long term rates
into at least summer.
Jan 29/06 - Interest rates have decided that maybe the lows
have been put in but what changed, as bond traders have been bullish of late.
Was it the foreigners selling, was it the large new government supply or was
there a removal of market liquidity? Well hedge funds actually witnessed a net
withdrawal of funds in this month. Hedge funds have loved playing the
carry trade but those profits are drying up, why pay high fees for meager returns.
With Greenspan leaving at the end of the month, Bernake may be too willing
to put on the brakes early as he is known to dislike the effects on deflation.
Inflation looks to move higher and as much as we do
not like making projections we will be closely monitoring our models for changes
in inflation and the real rate return. Inflation
reports are often delayed and the short term
commercial paper rate may indicate what to expect. Unbelievably, the
CRB index continues to new highs (along with
commodity funds) and this will eventually filter into higher prices for someone.
As Keynes said "jam tomorrow and never jam today"
Jan 21/06 - Due to some technical problems our site was
unavailable for part of Friday and Saturday. This week was full of action,
speculation and even a decline in GOOG but Friday was
the granddaddy of a market move of some significance. Our Strategy remains
long but as we indicated a few weeks ago the market Volatility
(VIX) was signaling a return to more higher (normal) levels. Why have
investors been so complacent about risk? The Fed has been signaling measured
rates ahead, analysts have been setting lower profit targets for corporations,
foreign capital has few alternatives. A lot of research indicates higher
volatility means higher corporate borrowing rates.
Why would that be as most companies have handfuls of money in the chest?
Company obligations are to shareholders (only payment obligations for
bondholders) and they will spend as they wish. Higher VIX also means more
uncertainty in the business cycle. Further, we are certain that institutional
investors may want to wait till the new Fed Chairman has given us indications on
his views of rates and the economy. On the commodity floor the
CRB pushed higher as did
Gold but GOLD Stocks (XAU) got left behind.
Oil looks like it may make that super spike that a
large brokerage once predicted not because of any shortage but because of
traders fear.
Jan 14/06- Did we hear the sounds of herding in the gold and
equity markets since the beginning of the year? If there was herding in the
markets the presence of contrarian behavior would act as negative reactor.
In our trading strategies payoff is dependent on the behavior of other traders.
However, trader actions are not the same as for small cap stocks as the may be
for S&P securities, bonds, commodities, or currencies. Traders act according to
market action or private information but never stop to consider how their
actions filter back into the markets, often in the form of noise. There is
always a large percentage of noise traders and when they are successful, markets
trend -either up or down. Today's GOLD
market is on a sell from the 535.00 level and the
XAU gold stock index issued a sell signal for
Monday Jan 16/2006. This may soon mark a short term top for other commodities as
short term rates have risen significantly to
offer an alternative to inflation (real rates).
In the equity markets the QQQ and IWM
remain strong and the signals remain on a buy. Please remember to check back
daily as we update the QQQQ signals daily in the
evening for the market open the next day.
Jan 07/06 - It was a great start to the year as the
QQQ rallied strongly to breakout levels. The real
news however is the consumer will see their minimum credit card payments double,
they will continue to shell out a larger percentage of their income for
petroleum (gas) and these expenses have been offset in prior years by rising
home prices. Oil prices are with a high degree probability to remain high
but home prices will be volatile and our best estimate, based on the difference
between interest rates and inflation (or if you
will ARM rates and inflation) is pointing to a soft landing ( at levels below
1.00) . The other news not receiving much attention was the china decision
to diversify their foreign holdings. This has a mute effect on bonds but
the US Dollar continued to fall. Why a large investor is US bonds would
inform the world they are likely to sell their holding I will leave to
speculation but I suspect even if they did not inform the media bond traders
would pick up the information. Commodity markets
continue to remain red hot with oil profits
likely spilling over into the precious metals.
On a final note the volatility index (VIX) is signaling
tougher times ahead in equity markets (nothing goes straight up).
Dec 31/05 - The markets did not provide any decent returns
for the year of 2005 and you could have avoided all the stress just being in a
GIC. There is no need to rehash 2005 as our readers are more sophisticated
than those who just go to blog pages for their dose of financial excitement.
We do not count on a single trade or even a good month to hang our hats on but
an entire year is a better measurement. Looking into 2006 the yield curve
will erase profits from smaller bank who will see their profits squeezed and the
junk bond will likely see rates soar as smaller companies compete against GM and
Ford for financing (not a hard choice). The yield curve is determined in part by
Greenspan and the other half by consumer preferences. The consumer preference
half is not well known, just look at all the new mortgages this year , they were
mainly for short term financing. People frame markets as short term and
now rates are also part of that category. Going into 2006 do not look for
any relief in the oil markets and Gold may have had its best year as inflation
is not a current concern. For 2006 investors will have a greater appetite for
risk, that behavior will reveal itself in higher market
volatility. Thanks to all our viewers for the quadrupling of our
traffic this year by informing their friends of the value our site has to
offer.
Dec 18/05 - Just as in a game of chance investors are often
under the assumption that what goes up must come down. The games of chance
also have hot streaks, but what they do not have is an upward drift. Over
time the markets have moved upwards, on top of that add in a few percentage
dividends and you have a positive expected outcome. This upward drift is what
makes market directional forecasting difficult. Like the old selling line used
in the financial services industry, being out of the market will cost you. The
only way to be ahead of the game is to have a positive expected outcome when you
are short the market and at other times to remain in a long position. The longer
a long position is maintained the higher your expected return (to the benchmark)
is likely to be. Further, returns are time varying and the times you are likely
to need funds for consumption will likely time when others also have a need,
thus you may be cashing out near a market bottom. As the fed may be
nearing the end of rate hikes and there decision to no longer publish M3
figures, the market will continue to lower the value of the USD into the new
year.
Dec 11/05 - It is often our tendencies that get the best of
us and others have learned to profit from these behaviors. People often
tend to but the momentum such as the 20 day moving average, for system traders
and market markers tend to front run such opportunity as they know buyers will
be waiting just north of their buying point. This is low risk at its finest.
What we search for are combinations of tradeable opportunities that others most
likely have not noticed. In some cases we have noticed large volumes and
rapid price movements in indexes just as some of our strategies have give a buy
or sell signal. We find this to be more than just coincidence and others
may be applying some of the same strategies and inputs that we employ. In
the week the headline grabber was GOLD, as we
alluded to last week inflation is likely to see some resurgence. The
XAU failed to keep pace with the metal as
buyers may be indicating their preference for the commodity versus stocks. The
bond markets are showing a high level of volatility
and may be attempting to gauge if the Fed is likely to keep a measured pace,
there may be a move in bonds by weeks end.
Dec 04/05 - A good trend eventually ends, this is what our
strategy is indicating for the US Dollar index as a sell
signal is issued for next week. Is the Oracle of Omaha about to be proven right
again by betting against the dollar? Over the past year as short term
rates moved higher it attracted foreign investors and some funds were
repatriated under the US administration policies. Whether or not this is just a
short term signal or a long term trend remains to be seen. Under the
shadow of a falling US Dollar, GOLD continues to
shine and looks headed higher - along with the CRB
index (long term). This leads us too believe inflation is not going away and
investors do not believe the Fed that inflation has
been contained and we are near the end of rising short
term rates. The fellows at PIMCO may want to believe that the economy can
not handle higher rates, but then again to bond investors higher rates mean
lower returns. Do not rush to any conclusions from a lower dollar or higher
commodity prices as the economy is an evolving matter and recent changes may not
have a direct correlation on future economic strength or weakness.
Nov 26/05 - The markets may not be rational but on the other
hand they are also not irrational even though at times certain stocks may behave
that way. The power of greed is well understood and traders are keen to jump
onto the prospect of quick enrichment. The new market pundits point to an
avoidance of market risk such as interest rate risk, inflation risk, currency
risk and general market risk. The simple truth is that investors are paid
or punished for taking risk, and market risk accounts for about 50% of total
risk. Market risk is our focus point and reducing market noise is our goal.
The noise in the markets is a function of fear, not of the type that the VIX is
composed of but one that makes all investors react (sometimes more than others).
Can this fear be reduced with statistics and probabilities? Statistics and risk
go hand in hand BUT what about fear? We would reply as would the Nobel economist
Gary Becker might suggest "People respond to fear, not risk". Further, we would
argue that to measure fear we need to look at alternative market markers, not at
the single volatility index. As we have mentioned previously, it would be unwise
to use a single variable to
measure something that is difficult to measure. Just as in the rush to empty a
building, we do not need a fire - only a group of individuals rushing for the
exits for no explainable reasons.
Nov 19/05 - The current obsession with the new Fed Chairman
has made bond traders glasses a lot rosier. The Fed chair plays an important
part but the economy rolls the way the consumer likes. If you need further info
on the fed's policies just google his name and get a listing of published papers
into his train of thought. The interest rate
scenario has been too focused on the 10 year bond - as short as the
five year bond, rates continue to push higher. It
is the quality of debt that will become the issue in the bond traders world in
the near future. Further the output from this weekend meeting with Asian
leaders will give the senate much information on any further currency valuations
by China. As the US dollar moves higher look for some
stabilization in the markets, people are becoming attracted to the trend.
The other trend maker GOLD/XAU is set to
go short Monday morning (this is a volatile minefield and not for trades who
value preservation of capital). Finally, as the flu season gets under way, the
bird flu headlines are sure to increase as is speculation in bio-techs.
Nov 13/05 - Single Variable Fallacy
Nov 06/05 - Risk is not a cute little mathematical formula
you can just plug into a strategy to get your VAR (value at risk). Risk takes
the form of volatility in the markets and the willingness of investors to accept
risk. In its simplest form investors are willing to accept risk as long as
prices are moving up and all there friends are telling them they will be eager
buyers on any weakness. However, it is difficult to prepare for risk at
all times as often it is like a tornado that forms in the midst of a storm and
leaves destruction in its path. The only possible storm brewing these days is in
the bond markets. As short term rates move
higher in the US and the rally in the Dollar continues,
look for other countries to follow. The nasdaq is
near its yearly highs and our daily strategy is advising a short position. Our
biggest success will be on what train we get on and not where the past has been
(could the recent buying be associated with a pre-emptive year end rally, as
October is often market by market lows).
Oct 30/05 - It's month end again, and the markets have large
amounts of funds moving into the markets via your monthly mutual fund
contribution and people cleaning out the cookie jars looking for funds to pump
into the markets. Just like clock work and much more reliable than moving
averages, the markets move highest when we need to invest. In any market that
offers potential for profit with reduced risk, the sharks move in. This is
not a free lunch, just one that is one special from time to time and just like
the January effect it keeps getting moved back slowly until the effect
disappears. The week ahead introduces increased
volatility and a Fed that may no longer be restrained in its comments about
inflation. The political spectrum will become full of speculations and
the future of the government to implement changes may become doubtful (or more
difficult). Just like the four year presidential cycle and markets, the
changes in legislation have much impact on corporate profitability (ie tax rate,
tariffs, special deals etc.). Finally, we have also made changes to
our site with the addition of the XAU index and
a weekly US dollar investment trading strategy.
Oct 23/05 - As the yield curve
heads toward the negative side of the curve, the markets were playing musical
chairs as the nasdaq ended up and the dow ended in negative territory. It
sits idle as investors become anxious about the next move?? in these type of
situations many are waiting for the break or loading up positions in
anticipation of a move. Our volatility markers are indicating a move to the
upside accompanied with a strong move in short term
rates and commercial paper moving to the
5% range in short order. It is of our opinion that short term rates determine
the return on assets as assets compete against one another for investment. In
the North (Canada) the BOC is expected to raise their prime and it looks like
the 10 year Canadian Bond is flashing a sell
for Monday morning. Could the Canadian Yield curve not be heading south as their
economy continues to show excellent strength. On a final note one of our fellow
trading sites, www.oextrader.com has a
great dow trading strategy
that warrants close monitoring.
Oct 15/05 - It was not a good week except for
CRB traders. Equity, oil, and
bonds all ended in a losing position and
inflation is once again making headlines. The rate
of inflation has not been this strong since the early 1990's. The type
of inflation is unfortunately not one that lead to higher earnings, unless you
are the government and make a percentage of all oil
and gas sales. The US dollar is starting to gain strength against the
Cdn dollar and Yen, as rates
move higher and the rate of corporate default (already showing up in the
DJ Bond Index) things do not bode well for most
markets in the rest of October. I do not want to sound like a bear but leading
up to the Fed meeting in November the market may be grasping for ideas to
justify its current lofty levels.
Oct 08/05 - The week in the markets was one marked by
VOLATILITY. This strange animal called "volatility" is something that is
often referred to as the fear indicator. We have found an anomaly in
volatility, not perfect, but it is pointing to a high point in volatility early
next week. What does this mean for the markets? It most likely indicates
the selling will subside and the markets will start to move in a sideways
pattern. However, the Russell 2000
is pointing to further downside activity in the near term. The
CRB index continues to power ahead even as
oil volatility has caused it to trade near its
lower end. As we have stated recently the yield curve
is not likely to go negative and pressure continues to mount on longer
term rates to move higher. For individual stocks ,
NT is pointing lower after breaking the $4.00 Cdn
barrier , the pimco bond fund PHK is also moving lower. In
an environment of rising rates the US dollar will also likely benefit in the
longer term.
Oct 02/05 - More important than any market move this week,
the revealed scam by the Bayou Hedge Fund that was apparently run by a couple of
smart people who's luck ran out but their image got in the way of admitting the
error of their strategy earlier. Could it be that hedge fund results are
highly overstated due to survivorship bias and/or most have not been operating
long enough? These are the questions you need to ask yourself when you park your
funds with the professionals - a good resume does not guarnattee success in
actual trading results. The markets
continue to show strength even with higher commodity
prices and looming fed fed increases that could take
short term rates up to 5% in early 2006. The
yield curve is showing signs of reversing its
downward trend as the focus has turned to the Fed's unconvincing fight against
taking inflation seriously. The hurricane's
have left allot of cars to be replaced in the near future and
GM is poised for a rebound from its current levels. On a final note, even as
hedge funds have attempted to get us to think in terms of risk and arbitrage, in
times of crises the correlations break down and Asset Allocation once again
becomes vital.
Sept 25/05 - In a week that began poor as speculation of a
category 5 hurricane wiping out the oil platforms in the gulf to the eventual
decline to a category 3 and a change in direction to missing most major
platforms the markets recovered slightly. As stated last week the
commodities are in a rotating lead and that points
to higher prices and continued inflation. An interesting development on
Friday was the sharp pick-up in 10 year rates, this is marking for volatility in
the yield curve which may possibly signal a buy
early next week with a slightly higher long term rate. The longer term
rates indicate traders expectations of future risk, liquidity and even inflation
expectations. We do however expect to see strength in the US dollar over
the coming months as attention is being brought back onto the worlds largest
economy. For current positions on securities please see our
Stock page, some will notice that when one
stock goes on a buy many others also follow, thus our payoffs depend on the
timing of other key players (banks, institutions, hedge funds) who follow
similar strategies.
Sept 17/05 - It is now time for Oil to move aside for the
weeks big mover - GOLD. It would appear that
traders may be signaling that inflation is on its way back and that the Fed
needs to continue raising rates. We shall have the answer to the second part
early this week. It would appear that the CRB
index now has rotating commodities and that would point to higher index
levels in the coming months. The lone oil security that we follow,
PHK, also turned bearish last week. Last week we pointed out that the
yield curve may not go negative and this week
longer term bond traders were demanded a higher premium - a trend that should
continue this week. On the equity markets
we continue to be slightly bearish with a move coming after the fed meeting (as
people wait to see what others do). As Benjamin Graham said "You are neither
right nor wrong because others agree with you. You will be right if the
facts and reasoning are correct." On a final note we will be updating the
site daily with a QQQQ trading strategy that has up to
two entry prices and two short entry points. If there has been two long entry
points they are both sold out at the first short entry point and visa versa. The
second entry (long or short) if for people who like to dollar cost average.
All entry points will be made at market open, giving the opportunity for even
better fills if the market is moving against us. Best wishes to all our readers.
Sept 11/05 - Some recent studies on behavioral finance have
attempted to convince us market participants behavior is the ultimate leading
indicator for stocks. If this were true them most fundamental analysis would be
of little value. It has been our observation that sentiment is a second order
result of the movement of securities, thus it is a result of prices moving.
Another area that has become a topic of great interest to us is the theory of
Liquidity Preference and how bank and the central bank work to provide liquidity
to markets. In today's environment this is most obvious in the real estate
market. The banks are willing to provide liquidity like a river feeds the ocean,
it just keeps coming. When the river starts to turn to a stream, the removal of
liquidity will dampen the appetite for real estate and thus dampen prices. As a
market example, in October of 1987, the fed stood by to supply liquidity to
large market brokers and market makers in an attempt to stabilize prices and
this happened again after September 11.There will be more forthcoming on
liquidity and the markets. In an interesting turn of events the yield
curve is no longer signaling a negative curve, and the bond markets are both
signaling higher yields for long term bonds (TLT and PHK). This is most
likely pointing to a stronger US dollar as the fed may continue to raise the Fed
Funds rate later this month.
Sept. 04/05 - Regardless of the markets, it was not a good
week for those in Katrina's path or those who were left stranded in New Orleans.
For them money is not a prize mere survival is of the essence. From this
disaster will spring changes in the GNP, employment,
commodity prices and larger budget deficits. How will this possibly
play out in the markets? Our main concern is the displacement of such a large
city will cause wage increases to moderate in the short term and the government
printing press to run overtime. In the short term rates may have
stabilized in the long term but turbulence in the
short term for the US Dollar will cause short term
rates to move higher. How will the trend
traders fair? In is of our opinion that trend traders help the noise
traders in their course of action instead of fighting them as Keynes noted the
market can remain irrational longer than we can remain solvent. For
current stock ratings and positions please visit our
stock selector page.
Aug 28/05 - In what appears a replay of not getting involved
in strong markets, Canadian Bonds, the
CDN dollar , Gold and
even little Nortel are giving sell signals for
Monday morning. This is certainly a surprise but we also remember reading
a published paper whose study proved it is better to buy into lower GNP
countries than higher GNP countries. In the US equity markets there was
little to buy as bears took the upper hand on the back of Oil prices.
Higher oil is now showing up in the
inflation picture and we believe this will force the
Fed to move short term rates at a not so
measured pace. This week the Fed also announced that they would be targeting
hard assets - a sign that inflation is not the intended target. To this end we
soon expect the Yield Curve to be in a negative
position soon. In a higher rate environment the auto group has played
perhaps its final deal as GM is pointing lower on Monday at
market. The mortgage business at Annaly (NLY) may be
coming back soon as the selling may have been overdone and the smart wigs there
are coping with the changing interest rate environments. All the mayhem hold
well for the USD and TLT ishares
as they are they gainers in any flight to quality. On a final note the oil
pricing may be hot but investors should bail on some stock such as
PTF as they are pricing in much higher oil prices, better
to leave and get some back cheaper after monday.
Aug 15/05 - The big story by a tanker was the
OIL business and anything it has an impact on. The
oil industry has far reaching impacts esp. on the US dollar as funds leave to be
converted into other currencies. The weakness of
the UD dollar is somewhat alarming considering a rate rise by the fed and a rate
decline by Britain. The fed's action indicate
since there is a lack of inflation that they are actually targeting real asset
prices, such as real estate. The consequence of world trade is you are
able to import goods without the labor hassle, good for retail but not good for
the average Joe. In the end it limits worker bargaining power, even in the
face of inflation. Our concern for the average person is the low level of
savings as compared to corporations who now have have level of savings, thus the
low level of current funding requirements leading to too many dollars chasing
too few bonds. The yield curve is continung to wreck havoc on the mortgage
business as witness by Annaly (NLY). Our last
comment is on Gold, which in our opinion is just
another currency that happens to do good in times of inflation, trouble, and a
favorite of the eternal bear (not a good reason to buy).
Aug 08/05 - The market started the week great but by the end
of the week the effects of commodities and a whiff
of inflation was enough to hit the sell
button. All of our stocks are also on
sells with the exception of the emerging markets. Readers
of our site will know we are not fans of technical analysis, as we draw the line
on real analysis and so-called readings. The bond
market is also weak not just in the US but also in
Canada, this leads us to believe there is a
large increase about to happen in longer term rates. Coming in the next
few weeks will be an active QQQQ trading strategy that has only had one down
year in the last 15 years. On a last note the mortgage industry may not have
seen the bottom yet as there is no sign of an early bottom in
annaly (NLY) but the oil industry trust units of PTF (Petrofund
Energy Trust) may have just put in a top.
July 31/05 -It was another good week for investors but not a
good week in bonds or yield curve instruments. In particular,
Annaly Mortgage Corp.(NLY) took a big hit before and after
their earnings release. This security's earnings are subject to the
difference between short term and long term interest rate differences. Further
there will most likely be another interest rate hike this month by the fed
putting further pressure on firms profiting from the bond carry trade This is
increasing pressure for the Bank of Canada to also increase their rates or risk
a falling currency. . In the international markets the
BSE of India continues to move ahead nicely.
In a sign of a possible housing slowdown market prices are showing low demand
for lumber in the coming months. Consumers
are in the mood to shop especially at employee prices, when other were writing
off GM they came up with another idea to keep sales moving.
July 22/05- The markets are getting ready to make new highs
in a run-up into month end. Our. Asset
Allocation model is bullish among small cap stocks. Evidence points to a
strong economy into year end, even if we move into a negative
yield curve. We have found yield curve
analysis to be a leading indicator on the economy and the market indexes.
As we are now posting stocks along with
indexes, feedback on what stocks would be appreciated. Due to limited time we
can not update daily. In the bond market,
rates look to head higher esp. in the short term. The fed has made its
point clear, look for measured increases ahead. As George Akerlof has
indicated in "The Market for Lemons" the current holder knows more than the
purchaser. However, we need to look for signals the holders are deciding
to sell - we need to watch the fundamentals for information that leads sellers
intentions. Such is the fight for funds between different asset classes.
July 15/05- It was a good week for stocks and in particular
Nortel Networks (NT). We have been working
on a number of studies this week including a study of after sale IPO pricing and
closed end bond fund market, such as we have posted TLT
and PHK. Both bond funds are not painting a pretty
picture for rates in the near term. Also of interest will be the
currencies, as there has been much ado about the
strength of the greenback, in the short term it has most likely gotten ahead of
itself. In the fundamental world a currency needs a strong economy to stand on,
otherwise it will drop against stronger economies. Finally, due to the
large number of comments we have received on the housing market, I will post the
real rate returns in its entirety. It is up to the
reader to come to their own conclusion, but the chart shows housing market tops
in 1975, late 1980, 1993 and 2005. Not sure if this correlates with other
readers but on the west coast this was very close to housing market tops. Money
is invested in inflation assets or bonds, whichever offers the higher
return.
July 09/05- The week was marked by terrorism in London, but
the markets found strength to move ahead. There will always be setbacks
but the economic realities propel the markets not some act of disruption.
Some would like us to believe that we can diagnose the market the way a doctor
attempts to cure a sick patient. The error we find with this logic is
many, first whoever said the patient was sick and in need of treatment.
Further with an annualized upward drift of approx. 8% per year the patient looks
to be getting stronger with time, not weaker like your typical client.
This is not to knock doctors at all, contrary it is to acknowledge the fact that
most sciences are best suited for that which they were built to diagnose.
We would like to share with our readers two theories that we believe have merit
and are worthy of future study. First there is the IPO market, a market
with no past, most of what we know about the company is by word of mouth, there
will always be an appetite for the new and improved, companies have a large
capital base after the IPO often but there real reason it is of interest is that
often institutional buyers hold a large chunk of the stock which slowly moves
into the hands of the public. Secondly, there is the case of debits and
dividends. It appears that both force managers to pay out to others thus
not leaving them with cash to waste (this happens more than we want to believe).
Even though dividends are not mandatory once a company starts to issue dividends
they often find it sticky to cut back - case in point GM. Our interest in
debits and dividends is the fact that these companies trade in a similar fashion
but are on the opposite ends of the pecking order. Both pay out, just
different methods - so it is our hypothesis that both trade in similar fashions
(trends). You will also find our page changes as we have added stocks into
the mix like TLT and PHK. Both are
related to bonds and they are signaling higher rates. PKH is the (Pimco
High Income Fund) and as noted above we like to stick with the long plays
but avoid stocks when needed. The USD continues to pound the
Pound, Eurodollar, and
Yen. The next move in the commodity markets will be
important as the recent strength in the USD has left commodities unchanged (in
US dollars).
July 03/05 - It is a weekend of fireworks and fun, and the
next leg up in the strong US dollar. As we have pointed out since the beginning
of the year, this is the year of a strong US dollar accompanied with rising
short term rates. Our leaning lately have been toward the preferred world
and high paying bonds. With long term rates hovering nears decade lows, money
starts looking for risk. On the commodity front it would appear the recent
rise in Oil is going much higher - it is acting like a bull market by showing
comeback strength on Friday's (along with other significant events). The lumber
and CRB indexes are continuing to be weak, forcasting low inflation ahead with
little pricing power by corporations. Best Wishes to all.
June 26/05- These are very confusing times in the equity
markets, perhaps this is a sign that the yield curve
is about to drastically impact short term rates. Bill Gross of pimco has
been suggesting that long bond yields could drop to 3.50% but how else is a bond
fund to make money, but Jim Grant (the bear) has been advising just the
opposite. The interest rate world has been grabbing our attention lately
as is appears that central governments has come to believe that by controlling
the rates they could somehow control consumer spending. We will take the
side of Adam Smith and his concept of the invisible hand eventually setting the
course of the economy and markets. Complacency is the enemy of companies,
firms need leaders with a vision of what an organization can become.
Judging by the recent scandals the leaders are looking out for number one,
period. One of the firms that has lost leadership and market
capitalization is Nortel Networks. We are
currently working on a theory for valuing money losing firms that have also had
their stock battered over the last few years, the title will be Fallen Star
Valuation Method (How to Value Negative Earnings). These firms need to
move to models where ideas flow freely and are independent of rank and function.
Once intelligence about a firm is posted on an internal web site, executive's
will be surprised which employees and how many people will be accessing this
information. On a final note lumber prices are continuing to weaken, this
may be signaling an inventory build-up prior to the summer building season
that is not moving as fast as anticipated.,
June 18/05-The equity indexes put there best foot forward
with the S&P 500 touching off a new high for 2005. The upturn powered up
both the technology issues and the
small cap's. However the bright light was held
by oil as it powered ahead to all time highs, without the help of OPEC. It
looks like oil needs more than just being pulled out of the ground, the
processing of oil has apparently reached the limit and winter has yet to fall on
us. We were anticipating a fall in oil prices as was
Morgan Stanley, but I
will admit my mistakes and the others will continue on and they will be right
eventually (they have deep pockets). The gold
market continues the bull rally and may soon reach new highs, is this because
inflation is back and the yield curve is not going
to go negative as many market pundits expect. On a final note, the
REIT index made new highs in what appears to be real
estate investors finding a way into the hot housing markets without taking out a
new mortgage.
June 12/05-The currency markets continue favor the US as if
they know something about interest rates that others may not. Recently in
the press, it has been all but a certainty that the
yield curve will go negative. The bond ,currency
and gold markets are send somewhat confusing
messages but this is just like all the other times that the markets get most
people twisted and acting in irrational ways. The expectation is that the
fed will raise rates on more time, however the fed is also unhappy with the
current state of long term rates. Knowing the Fed has muscle but not
control we expect them to flex this muscles in the coming weeks. Look for long
rates to move much higher after the ten year bond reaches 4.10% . This is
no magic number but a ballpark figure of when the short hedge funds will likely
through in the towel. There are a number of reasons for long term rates to rise,
but in rolling correlations a stronger US dollar is connected with
rising interest rates, long and short term.
We are not heavy users of correlation studies as there are unreliable, ie like
the gold to oil ratio, oil to markets ratio, short interest to market ratio (you
get the idea). How many of them have ever made any money for you?
Finally we continue to be amazed by the REIT markets as
they defy our personal logic, but thankfully our models shed valuable light on
our own weakness. Finally, the driving force of interest rates is individual
time preference.
June 04/05-It was a strong market in treasuries as the
10 year bond rates plunged below the 4%
barrier and the yield curve is close to going
negative. On the short end rates
are continuing to move higher though at a slower rate. Going forward rates will
impact the USD and we are beginning to see the signs in the weakening
Canadian and Eurodollar.
After France voted against the EU constitution there is increasing concern
from the action of traders that perhaps the strength in the EU economy is not as
strong as previously thought. Further it appears that Europe is in fact
considering
cutting rates. Perceptions in trading are often as strong as
fundamentals, at this point it seems the US Dollar stands to benefit from both
perceptions and fundamentals. The rising short term US rates are acting like a
magnet for funds looking for a home. A strong dollar would be bearish for
Gold and commodities
in general. Our asset allocation models
continue to favor bonds, but there is short term strength in the
small cap indexes. The markets
action to date this year has been box of mixed fundamentals and strategies that
may have worked in the past are performing poorly-proving that opportunities for
profit vary across time. In other words, we need to spread risk across multiple
markets.
May 28/05- The bond market continued the upward drive in
short term yields and the downward drive in longer term yields. The bond market
is a different animal in that it looks at the present and not the future like
stocks. Why the importance of the present? Now is the time that investors
want to avoid stocks so bonds offer the only other reasonable low risk
alternative. On clue is the money supply which is looking like that of
he early seventies according to Jim Grant of the Interest Rate Observer, which triggered a bear market
in bonds. The talk of housing bubbles continues but they continue upward,
easy credit dictates today's real estate - not any yield return. House
prices are set according to wages of home buyers but rents are set by wages of
renters. The average Joe with two kids and an average household income of
50,000 with a 300,000 mortgage at age 40 will likely be paying that mortgage
into his sixties - that is if everything goes perfectly. People buying
homes are now thinking short term on a long term asset. This spells
trouble somewhere down the line. If readers have the inclination or time we
would be interested in knowing if the smallest of the small cap(Russell2000)
perform better in an up market or if there is no difference. We place a high
value on consistency but following movements by the crowd lead us to
complacency. People like to avoid a great deal of thought, we can use the
actions of others to validate choices. Investors look to the behavior of
others that have gone before them but the timeline to decide consistently
decreases (greater fool theory applies). This is why traders speak in
terms of trends being your friend, others validating them help you validate your
actions.
May 20/05 - The markets appear to be in good shape with the
Russell2000 and
Nasdaq both rising nicely over the last few weeks. The other good
market - REITS- have continued to rise despite warning
from the fed and Warren Buffet's warning that they use poor accounting.
There is good reason to get back into the markets and one of them is a good
dividend yield on some securities such as GM (but it pays a high rate for a good
reason, not because they like you). Over on the bond market
short rates are propelling higher and the
10 year maturity may be overacting as some hedge
funds were too eager to short. Watch the yield
curve model for signs of a return to more average levels. As Benjamin Graham
like to say that in the short run the market is a voting machine but in the long
run it is a weighted machine. We do not believe the hedge fund industry
will continue to prosper much longer as they have most likely reached the point
of saturation, besides why pay someone a 2-5% return to sit on cash - the
cutting of fees has a long way to go.
May 14/05 - The hot topic is no longer Oil and that may be
because it is below 50.00 and the new talk is of interest rates and possible
trouble at a German Bank. The interest rate difference is becoming a
puzzle and a pain for traders and Mr. Greenspan. The biggest question on our
mind is if the economy is doing so good then why have long term rates been
heading down - is if a few hedge funds getting clobbered for placing bad bets,
maybe it is a flight to safety or maybe it is just those foreigners not wanting
to tie up their money. Wait could it be nobody is interested in the long
term borrowing or investing and are thinking short term like in the housing
markets (getting interest only mortgages). If you thought there was
speculation in our markets take a look at shanghai . The
Canadian Dollar continues to drop and there may be
pressure in the near term to increase short term rates. However the
commodity based provinces have no friend in the CRB
index. The next few inflation numbers will hold the key to the future
of a possible rate curve inversion.
May 07/05 - The last week can best be described as a week for
tums. Viewers of our page will know that we turned bearish on
corporate bonds a few weeks ago and this week both GM
and Ford got a junk bond status. It remains our view that there will
shortly be an adjustment in the in the yield quality curve. To the north
the Canadian Dollar and
Bonds will begin to experience weakness due not to political issues but
commodity related weakness such as Oil and
Lumber. Due to personal issues this has
been a shortened issue.
April 30/05 - The macro economic picture is not that pretty,
so it may be time to take off the rose colored glasses. The best indicator of
the economy is not the so called leading economic indicators but the little
engine of job growth and innovation - the small business. Our asset
allocation model is built on this concept and it
remains bearish on stocks and bullish on long term bonds. We also track
that other group of traders - the hedge fund (even if most of the time they are
only net long) as they are important in the bond markets as a place to park
funds but charge their clients a nice 2% for this simple service. When
they all decide to do this it causes whipsaws in the markets that are temporary
as the long term is about fundamentals. One currency that is now weak, the
Canadian Dollar as the politics of a minority
government is weighing on some traders. This is further helped by the
falling lumber markets and a slowdown in the US housing market. You may
notice the markets fell before the numbers as is the case with most markets -
the truth is out there but the government numbers just put the icing on the
cake.
April 23/05 - The week was as bad as they come, and even
worse for trend followers as the whip saw effect saw people get pulled into a
200 point up day. This was also the case with oil as a drop to the
50 level looked like the bottom had fell out.
When volatility goes up so do the extreme trading days. The fossil fuels
are powering the world economy for the foreseeable future but out of the
woodworks will come ideas for a piece of the dreamers pie of unlimited
alternative energy. It may exist but the person finding it will not be in
a rush to sell it. The bond market looks weak for the
short term rates and surprisingly
corporate bonds. Earnings may currently look
good but further out we see an inflationary rise that companies are not able to
pass along to a public that has close to zero savings rate. On area of
weakness that our models did not detect was in the
lumber markets, the sharp drop in US housing starts came after this market
has already dropped by some 20% . Further weakness in this market and we
also will become bearish on wood. For long term investors our Asset
Allocation models sidestepped the current decline ( thanks to
Victor Niederhoffer for the base
of this model) and stayed long in bonds. Its good to know Greenspan and
the bond market are there when you have had a bad day in the markets (or as its
known -flight to quality). On a final note we would like to thank our
visitors for making us the top five search for interest rate forecasting on
google, MSN and yahoo.
April 16/05 - For Equity investors it was the worse week in
almost two years, all sectors got hit and there was no escape even in
gold. However, there was an outlet for all
those sellers and it was into the 10 year bond
markets, not the shorter end of the curve. There are many way to interpret
this but most likely it will result in a further decrease in the
bond yield spread. Is it just coincidence or
is the spread indicating a coming slowdown, such as was reported this week by
the Federal Reserve of drops in manufacturing and industrial production. Our
only escape was our Asset Allocation Model - the
long term model for investors and mutual fund types (not traders). Even
with the recent run-up in the USD index are models continue to be
bearish on the USD. There is a political element
in the air of the surrent state of getting the yuan revalued according to free
markets. This may be a market that the president can not win, the senate
knows who losses jobs losses his seat of power. We have two new strategies
to introduce, the REIT trading strategy, a low
correlation hedge against the markets. The other being the
real rates indicator, this is the difference
between 3 month tbill rates and the inflation rate. I was suprised to find
excellent correlations between the real rates and housing prices on the west
coast with tops (low in indicator) in the housing market occuring in 1980,1993
and 2004 with a slight lag.
April 10/05- Is the market in stages of fads and when the fad
begins metamorphosis old correlations begin to break down. Is that what
was happening this week as oil prices pulled back but
bond yields continue to rise. As we reported last week the call for an
oil spike lead to the volume needed for others to unload positions. The market
is ready to sell you as much as you need but may not be there to buy it all
back, unless you are crafty at creating the illusion and the greed. As for
the play on commodities are strategy currently is
to avoid them, but the record for this play has been good for the last two years
(in this case the rising market contributed to any smarts we added). I
have been further analyzing the COT data but am finding any knowledge
information added by noise trades as just more noise. We have however found
evidence that adding liquidity at day end can contribute to a handsome payoff
for so called scalpers as the market is not as picky about the price when all
are headed to the exits. As we have mentioned before in our columns it is not
being any brighter than makes your returns, it is being able to capitalize on
the risk made by others. In other words, the markets may in fact be a zero
sum game.
April 02/05-Friday was a good example of a whip saw day as
the markets rose into the morning and plunged into the afternoon.
Emotional trading or trend trading could have been hazardous to your health and
wealth. The objective of our strategies is to avoid the whipsaws that
accompany the market ups and down, investor mistakes are the source of our
returns and not some quantative trading methods that few can comprehend.
In investing intelligence does not necessarily equal returns just as the case in
any business. In simple terms if the market was just a bunch of numbers,
most mathematicians could be market magicians today. The trend is your
friend but we just need to be more certain a trend is underway. In the markets
it was mostly sideways to down for averages and the bond markets are showed
signs of stabilizing. In our opinion allot of folks are happy to see rates
rise as it contributes to their conservative income. Watch for market
forecasters to come out of the woodworks advising us that they have been calling
for a rise in long term rates, our idea of rates is to keep our readers current
with easy to read graphs such our corporate bond rate
strategy. In this graph as prices come down corporate bond rates go up.
The commodities market continues to show strength
and oil is becoming more volatile with a large
institution calling for a spike above 100. Now only if they could tell us
how many recent calls they made and what happed afterwards, but in this case
they are more interested in making the headlines and drawing some business.
March 28/05- Those of you who visited our bond page would see
we are very bearish both short and
long term on the bonds. The biggest drop next
will be in low quality issued bonds,ie read junk bonds. The
dollar had a nice bounce but this also appears
temporary as people got exited by the economic numbers and the talk by
Greenspan. We are not of the opinion that a one week up move makes a new trend.
The gold market took us by surprise as we are
still bullish on the metal and if the greenback continues it's decline then this
metal will shine once more. It was a poor showing by the equity markets
but that may be about to change or at least most
of the damage has been done. Viewers have been asking why we do not issue price
targets. People who issue price targets on indexes and say for example
that 1990 is an important level on the nasdaq can never be proven wrong.
There are only two possibilities that it crossed 1990 and moves higher or that
it almost reaches 1990 before heading lower. let us know if we have missed some
other conclusions. On a final thought the markets are never perfectly correlated
but if you search hard you may find investments are compared to the risk free
rate whether in the markets or even real estate.
March 19/05- It was once again another down week in the
equity markets but the commodities market is
showing good strength and maybe some temporary overheating. The
market bonds are both negative for the short
and long term. This week we are also presenting
a yield curve trading model comparing 10 year
rates less the 13 week tbill rate. When viewing the markets as bearish or
bullish it is a matter of perception, from those in our heads instead of
objective reality. The reality is what we create using manipulations to
fit our own views. However in almost all cases negative information
(such as the dollar plunging) is weighed more heavily than positive information.
This is consistent with the much held belief that people are motivated to
protect themselves or in this case their assets. As mentioned last week
memory is a poor tool for analysis due to its limited ability to deal with
complex matters, what ends up often occurring is that people use association and
expectations to make connections about events to impute meaning not manifested
in the information (message) itself.
March 11/05-The equity markets are once again taking their
cue from the oil and commodity markets, and started to head south especially
small cap stocks. The effect of the
oil markets on the equity markets is more a perception of cause and effect than
any rational trading theory we could suggest. It appears people are applying
simplifying strategies and new rules of thumb in order to avoid the burden of
making complex judgements, this is often referred to as a cognitive bias in
behavioral economics. In our opinion
once individuals form a specific opinion it is difficult for them to see
otherwise As we have stated previously it is better to locate evidence
that is lacking instead of finding more evidence that is supporting of your
theory. On a final note, the US dollar is continuing to
show weakness even as short and now long term interest
rates are rising. The media is also touting stories of foreign
investors looking to diversify out of the US dollar. Every time one of
these stories appears the central bank of the country the story originated from
goes to great lengths to explain the misunderstanding.
March 05/05- The markets continue to put on a good showing
and the commodity markets are especially strong as is show in our Canadian site
tsxtrader.com for TSX small cap stocks and in the
CRB index. Further in our
COT charts the average small investor was betting
against higher temporary oil prices. In analyzing indexes and commodities there
is no longer the problem of not enough information, but the problem of too much
information. Hard information is incomplete and the signals often get lost
in the noise and that is where we train our systems to extract the meaningful
from the mundane. We have chosen to avoid the reliance on personal beliefs
or assumptions as a mind set in not only biased but it is unavoidable. New
information is not likely to have a large impact on our analysis as is looking
at the information from a new perspective. For example, we can be fairly
certain that over the long run there is an upward bias in the market (the so
called 8%drift) that therefore any system we develop should also be titled by
this factor. The next time you are stuck for a new idea try to write it out or
talk it out as they both require different parts of the brain.
Feb 26/05 - It was down and then back up as the markets
basically finished unchanged for the week. Our
Nasdaq trading system did not bail on the decline and held on as the markets
rose, just one of the ways to avoid the whipsaw and have fewer trades and thus
less transaction costs. We are not statistical data miners, what we look
for in the markets are consequences of the most carried news story, anticipated
economic events, and investor behavior not in isolation but as components of one
another. The markets are full of ideas of knowledge that is not new at all
and is often redundant and full of contradictions. In the future we may go
into more detail but I believe that the reader can draw his own conclusions
about what they have observed from their regular visits to our site. Many
of of readers must be suggesting our site to their friends and acquaintances as
our readership has steadily increased. We would suggest that you may also
suggest to your friends our site as they may find something of value to them for
which they would be thankful to you. The big story this week was the jump in
gold prices and gold stocks. Once again OPEC was talking up oil prices
but we do not at this time have faith in that rally. It is about talk for
their own benefit, we would ask if a CEO would talk of their stock price the
same way? Why the oil rally, our best guess is that of the Keynesian
beauty contest, it can often be profitable to bet on the beliefs of other
investors. Where investors look for facts to support their trading
strategies we will look for contra evidence to nullify our theories.
Feb 20/05-It was a week of all Alan Greenspan and the talk of
rates and inflation. Will his talk be enough
to turn the corner on the longer term maturities or will this just be a short
term up move in the 10 year bond rates that we witnessed this week. Our
corporate bond system has yet to flash a sell but we
are close and may update you during the week, stay tuned. The other trend
our systems noticed but is not yet in the public media is that the US dollar is
being weakened against all foreign currencies including
gold. Taking a biased guess would lead one
to believe that higher rates are now failing to attract foreign buyers for the
US currency and in response rates will be heading higher. The equity
markets continue to buy time on the upside and with low volatility we see little
move either way. With talk this week by OPEC of cutting
oil production and them being unable to meet China's need by year end we
just see this as another reason and attempt to keep prices artificially high.
From out TV and internet screen it looks like to many folks have moved into the
manipulate the public for extraction of maximum profit, it's just a matter of
time before folks stop buying the talk (read as BS) or their products.
Feb 13/05-Market ideas, models, systems, and theories are all
formed from a mental picture we take of the world and the market in particular.
Are our ideas really new or are they just rehashed ideas of concepts that people
have used in the past. In our opinion concepts on the market are often
flawed due to participants entering the markets with
pre-conceived ideas and those are difficult to ignore or change. It is
difficult to capture a web of correlated, dependent and interdependent processes
in a single model. Stated as simply as we can trading models can be as
simple as price and time or as complex as macro-global economic impacts on the
economy and on the markets. There is however some evidence that the
countries with the highest GDP may not produce the best market returns - sounds
like a remake on contrarian investing.
Feb 06/05- The markets are picking up action on the upside
and oil prices are continuing to drop. There has been much talk about the
low levels of volatility in the options market over the last few weeks. It
appears to us that the markets have been volatile but hte options market is
becoming saturated with options writers. Many of these folks have been
drawn in my some TV promotion believing it is an easy road to riches. It
is nothing further from the truth, a few bad options writing and you could end
up broke as an options buyer you are just holding a decaying asset. In a
lot of ways the options markets is like a casino, the house holds the edge and
the house is the one that can survive the fat tails. This week we have
added a new strategy for trading the S&P 500 equal weighted index - it has fewer
trades than the nasdaq strategy and pays a dividend when held in the etf
SPY. The markets don't move themselves it is the participants aggregate
action that causes the end result.
Jan 29/05- It was a sideways week that continues to have a
downward bias. Both our long term and
short term strategies remain bearish.
In will be an uneventful week on the oil front as
traders have overestimated the impact of Iraq on the oil picture. The
other oil players have quickly moved to restore lost oil in the system and help
offset their US dollar losses. However the dollar
will be the big story of 2005 as we have indicated since the end of 2004.
It has come to our attention that earnings and earnings quality look poor so far
this year, our response is that earning have a poor correlation to prices and
that much better results are gleaned from reviewing the way the P/E Ratio is
moving. PE has the ability to move prices on its own without real
earnings. Why would that be? Are not earnings the driver of the markets?
In the long term no earnings eventually mean a zero stock price but the long
term is over a decade, just look at all the biotech stocks that have had
negative earnings since when? On a final note our Nasdaq 100 traders will
be getting a better short price than us as our real target was hit but it just
missed the target we issued, well that's just the way it goes sometimes - bad
for us good for our readers.
Jan 22/05 - It was another week that most day traders and
institutional investors would rather forget. The volatility may be picking
up but it is getting harder to make profits and both short term
commercial paper rates are moving up and the
markets are having a negative rate of return. There may be an adjustment in the
dividend rate on the Dow as it appears that the easy credit terms that have
become available thanks to hedge fund and derivative traders may be coming to an
end for corporations. The has bee speculation in the popular press that GM
bonds may be cut to junk bond status. Now if GM is at junk bond status
what will be the implications for the other industries? May I add that it
is of our opinion that bond traders are generally more in the know about company
financial status than the average stock trader - most likely they have the a lot
of funds on the line. Security prices have a tendency to gravitate back to
fundamental values but the adjustment is usually spread over a number of years.
The one strong point is the US dollar especially
against the BP . Our technical analysts friends next line of support is
after another drop of 5-6% in the equity markets and they have gone negative
with the oex (the old QQQQ for option traders) now below the 50 day moving
average.
Jan 15/05-The last two weeks have been the weakest start in
the markets since 1990. Going forward the markets continue to look weak but the
US Dollar is gaining strength on the back of short term interest rates. Further
interest rates look to be heading higher both in the US and
Canada. This may become the environment of
coming higher rates that has been announced by the Treasury in some of their
press releases. Jan. 14 (Bloomberg) -- The dollar rose a cent against
the euro, the most in a week, after a Federal Reserve official suggested policy
makers may accelerate the pace of interest-rate increases, widening a gap with
the euro region. Lets take a wait a see approach on the fed moves. We would
like to recommend a site that is updated daily and does not charge and that is
http://www.brettsteenbarger.com/
. It has some great articles on trading behavior and market trading ideas
by a person who shows integrity and honesty.
Jan 09/05- It is the middle of winter and this bear is coming
out of hibernation to take some revenge on the bulls. Does this mean the
rally is over? Currently both are short and
long terms market strategies are recommending
shorting the equity markets. As we pointed out last week the action will
be in the US Dollar - look at what happened this week to the
BP and the other currency
Gold. The catalyst may come for this as firms begin to move out of US
markets and into local markets, particularly the close to the Chinese new year.
At this point we are not particularly about any particular markets and are even
seeing some weakness in the 10 year bond markets. We will keep you posted
as we expect there may be sell signal coming in the corporate bond index - this
would be a bad sign particularly for the lower grade bonds i.e.. junk .
Jan 01/05-For the month of January we will be updated our
site daily for the MLO (QQQQ) strategy. This will show how our strategy
performs in real time use, however there is a catch. Due to our own use,
the strategy will be updated to the nearest number so that we will be able to
trade ahead of others-recall this is a free site and the info posted will be
what is used to show performance. We are under no illusion, the market is
difficult to beat and we know less than many people visiting our site. We
also have less access to the info hedge funds have but I have heard the
best hedge funds use information that is available free of charge. If
people offer you data they believe is valuable, why would they provide it for
such a small fee. People have a tendency to believe more in their
forecasts with more information. We no longer cling to views or forecasts
but are open to change when our systems indicate. This is where we part
with other analysts - they tell you has happened after it already has. For
the week ahead we expect markets to continue to rally , oil is still showing
weakness and the dollar will be the play of the year for 2005.
Dec 28/04- Unfortunate events this week in south Asia will
see the spread of news that we have not witnessed since 9/11 . Some ideas
are likely to become widespread will others will be subject to only a few.
The most dramatic events attract the most attention and there will be a number
of theories of how this will affect stock X or Y. Be aware that ideas
spreading does not depend on any truth, rationality, or likelihood of becoming a
truth but are designed to address and emotional appeal. For us more
fortunate souls donations can be made at
http://www.redcross.org/ to help in the Asia crises.
Dec 18/04-It is the week before Christmas and most traders
still believe they are superior traders (retail and institutional) compared to
their peers. Well Santa is on the way and he may in fact deliver a
rising market until year end. The truth of
short term capital gains is that they must come from someone for your gain esp.
in the futures market. It is our humble belief trading profits are not a
result of your superior skills (sorry all you hedge fund managers) but the
result of mistakes made by others. Average traders make average mistakes
it is just human nature and this is the source of others gain. How and
when these mistakes are made are the questions one should ask themselves so 1)
they try their darnest not to repeat 2) find ways of capitalizing on them (if
possible). The market anomalies discovered by some in their ivory towers
are a trick of statistics and they may fail to recognize when these anomalies
have lost their advantage. We have seem this happen many times with
systems that we have developed in the past and notice with some that continue to
work but have reduced profitability. Merry Christmas to ALL and may you
receive all that you need.
Dec 11/04 - As we saw this week in the oil and gold markets
that it is best to reduce your exposure to the hottest markets unless of course
you enjoy the volatility ride. If you are seeking out the next hot stock,
commodity or market sector that you will most likely doom yourself to poor
returns as markets can not top until all riders have boarded. In our
commentary last week we noted that hedge funds were attempting to break the
technical bonds traders and that is one of the reasons we do not make wide use
of technicals. If others now what you are using they will find methods of
profiting on that information. For example people you use the dogs of the
dow system will pay a higher price for those stocks than they did in the past.
How is this possible? Lets see, if I know there will be ready buyers for
my stock on Jan.01 then why would I not go out early, say Dec 26 and then sell
the stock to waiting buyers on Jan 01 for hopefully more. This is a low
risk trade that is eroding the returns of the dogs of the dow system. There was
a downward drift in the markets this week and currently we are holding long in
our asset allocation system. Our Oil and
Lumber systems are both on sell and we expect a slowdown in the other commodity
markets as the USD gains strength . Mid week we issued a special
signal to exit foreign currencies- for example the Canadian
dollar fell sharply after the Bank of Canada decided to not raise rates. In
addition rising short term US rates are providing a floor for US dollar (see
previous postings on this subject). Here are the
3 month rates and the
Corporate Bond Index that has a good correlation with the etf LQD
issued by http://www.ishares.com/ .
Dec 08/04 - Special Update as all currencies are now
short vs the USD and Gold
has most likely seen the high for this year.
Dec 04/04 - November was a great month for the equity markets
as our short term trader on the Russell 2000
continues to stay long. We are adding a new strategy for the
Nasdaq 100 (QQQ or QQQQ) that is composed of an
almost equal weight index and has an excellent correlation with the Q's. With
all the volatility in the dollar we would not be surprised to find some support
at the current levels esp. as other countries are holding off raising interest
rates. Our corporate bond strategy continues to
be long even thought there was a run by some hedge funds early in the week to
tip the scales on all you technical trader types - the watch the support and
resistance lines and attempt to move markets through them so they will get
others to react, thus creating opportunities for themselves. In the
commodity markets lumber is continuing to show
excellent strength as the US is attempting to keep up the tariffs of Canadian
lumber. We do not venture onto the political scene as there may a
change of direction as often as the winds change. If you are looking for
good deals it looks like Walmart will start chopping prices again - is there any
other reason people shop there? Happy shopping....
Nov 26/04 - It was a slow week as traders were taking an
extra long weekend and the fear got the best of people as
gold continues to rally past the 450 mark, our
strategy is to remain long till the end of the year (that may change).
As this has been a rally in the Canadian Dollar and funds continue to pour north
we are introducing a new strategy to trade the TSX market with the popular ETF
XIU. For more info on this exchange traded
fund visit
http://www.iunits.com/english/funds/fundprofiles/i60/index.cfm , the
fund has good liquidity and provides diversification for global investors in
terms of currency and access to Canadian equity markets.
US equity markets continue to be bullish
and there is further potential to the upside, the bond market is of concern to
us as short rates continue to climb and
longer rates are at a standstill. We expect
this to change in the coming weeks as there are rumors that foreign investors
are tired of taking a beating in the US dollar.
Basically the exchange rates are producing negative returns and eventually you
will decide to take your money elsewhere.
Nov 20/04 - Sticking your neck out in front of other fund
managers is likely to see you out the door and maybe that is the best reason
most managers are sticking to playing the indexes. Short term
underperformance is likely to get you fired and not moving money is likely to
help you lose clients, after all they are paying fund managers to manage money -
not let it sit idle. All of this is present in today's currency markets as
the USD dollar continues to tumble ahead of the G20 meeting this weekend.
We will not speculate on the outcome of any meeting to support the greenback but
as Warren Buffet has warned "You pay a dear price for a cheery consensus".
Short term rates continue upward and this should limit the bottom
of any further USD decline, also the Canadian Dollar is
showing weakness. Looking at the week ahead we continue to be bullish
on oil, gold,
lumber and the
commodities in general but short term bearish in
small cap stocks. Friday's downward
action in the equity markets brought out the bears after a good rally over the
last month but our asset
allocation models continue to be long over the next few months as the
downside of any declining US dollar will be higher revenues for firms doing
business outside of the US - earnings growth equals higher stock valuations in
the long term. If you would like a little less action the
Australian markets are showing good upside
potential. One area of concern is the high yield equities market as funds
flowing into this sector over the first nine months have been setting records
and we will be watching carefully as these new funds
will exit faster than they arrived on the first sign of perceived trouble.
Nov 15/04 - The equity markets
are continuing to show good strength even as the US dollar is grabbing the
headlines. Are strategies are showing the US dollar weakness continues
against the Canadian Dollar , Japanese Yen, Eurodollar
and the British Pound. Also showing strength is
Gold which is currently bullish - I would like to
thank our readers for valuable input into this market as our last signal was
confusing to some. The bond markets look steady as she goes in the long
end but short term rates will continue up for
the next few months. One of the reasons for this is that foreign
depositors are now requiring a premium to offset any currency losses and US
budget uncertainties. Other markets that are good investments are the
Canadian and
Australian equity markets, both rich in commodity based industries.
Nov 06/04 - The elections are over and the markets are ready
to roar to new heights. The US employment numbers are looking good and the
chances of a fed rate increase are now much higher. Even with a potential
rate increase the US dollar compared to the Canadian dollar
or the Euro is at monthly lows. A growing GNP,
increased hiring and a rising market usually are trademarks of a strong
currency. Canadian investors are
discovering it is better not to have diversified or at a minimum they should
have considered a currency hedge to offset the exchange risk. We have a reit
trading strategy that we will be presenting in the coming weeks as
interest rates are about to get exciting in both
the short term and long term. In the commodity markets the
CRB index is showing strength, the
Oil sector is continuing to play out and
Gold markets may have overheated. Our
Asset Allocation models continue to be
fully investing in stocks and will likely continue to outperform the 10 year
bonds over the next few months. Have a great weekend.
Oct 29/04 - Oil was definitely the big mover and shaker of
the week, but we expect to see more volatility from oil
in the coming weeks (as a volatile body tends to stay volatile). The other big
performer for the month was a $9.00 gain in the price of
gold as the US dollar continues to need assistance
from short term rates to recover. The Dow put
in a strong performance breaking the 10,000 barrier with two days of over 100
point gains, we continue to be long the small
caps (our market proxy) in the market. In the near future we are
considering moving into bond and reit speculation as the market players are
looking for ways to reduce volatility and have reliable sources of income. Do
not forget to go out and vote.
Oct 23/04- The week was not so much about what is happening
in the equity or
bond markets but the declining us dollar. All
currencies are just beating on the US dollar and this is making us a little
nervous about what is likely around the corner for the economy and the GDP.
With the president signing the bill to give companies a 132B tax break, where
are those funds headed. In our political opinion this is either a
desperate move or a going away present. The other factor is
Oil prices are just headed higher based on the
falling dollar. We are leaving the oil chart up as this is on most people's
mind. Also our COT charts are showing the
small players are very bearish about most commodities will are
CRB index and GOLD flashed
a buy signal last month. There could end up being a massive rally in the
commodity market, lets let time be the judge.
Oct 18/04 - The buy at 574, we posted for the
Russell 2000 is no longer valid. In order
for us to keep you updated on this index it would be necessary to post everyday.
This may happen in the future but currently time is an issue.
Oct 16/04-It was a down week and a lot of people are becoming
the pessimist. Is this a contrarian's web site now? To us contrarians are just
coincidental indicators as for the most part the masses lead the economy.
This is especially true in the housing market as increased land values are
creating credit in the system and construction jobs, finance jobs, government
jobs and even paperwork for lawyers. Our one concern is that if things are
so good in the housing market and lumber is used
to build houses then why has the price fallen 25% in
the past month (are we off the mark?). The truth about market tops is that they are evident after
the fact the rest is just guesses, lets make our best guess as they are just as
likely to be correct as the next persons. The bond market
is painting a rosy picture for bonds for the next quarter or so as inflation
remains under control. Oil prices are the big
tax that people do not like paying and this will extract funds out of the
economy - unfortunately for the retailers just before the big rush.
If you see aggressive price cutting before Christmas look out for the consumer
losing steam and a slower GDP into the new year. Since we currently only have
time to update the site on weekends most of the time the next short term buy on
the Russell 2000 will be at 574 level.
Oct 11/04 - This is a special update as we have noticed a
large interest in our corn COT charts. Just as a one time favor I am
posting a corn
strategy to help navigate this maze of corn. As I drive by the
freeway I wonder how easy it would be to get lost in those fields and how any
help would be welcome. If you or your firm would like updates like this
please email us.
Oct 09/04 -Its looking like we may have made a lousy call on
bonds, but we will let our systems decide the time to exit or stay short.
The truth of investing is that if you think you are going to be right most of
the time, well all I got to say is that the casino's only need a 1% edge to take
all your money the next time you are in Vegas. If you want to test
something you got to check more than just your last card that was dealt to you.
As for the week Oil is continuing to take funds
from anyone (and there are allot of them who believe that fundamentally the
prices are too high). The commodities rally seems to be underway except
for this bear up the tree of the lumber market.
It looks like the hurricane rebuilding will not need all that lumber or the US
housing market is losing steam or both. We do not try to reason why prices
must act this way or that anymore than we should guess on the outcome of the
election on some economist prediction that a higher market makes for the current
president to win based on a sample of less than 20??? We would be the
first to doubt this small sample and we are just amateurs in the math world.
Have a great long weekend.
Oct 06/04 - Special update tonight as
bonds moved to a sell today and our asset
allocation models moved out of bonds and into stocks. In fact it may
well turn out to be an excellent time to short bonds.
Oct 02/04-It was a good week for the
equity markets but the bond market may be
looking to turn down in the near future as the economy picks up steam as
witnessed by a rise in the CRB index. The Canadian
and Australian markets continue to impress us -
they must have know something about the commodity markets before the rest of us.
Like many pundits have been wishing for a while we can not have rising bond and
commodity markets, this is like wishing it would change and fighting a losing
battle based on historical conditions. Further to the rising markets in
Canada it looks like our belief that a currency has an impact on equity markets
is being played out. Why would a currency impact the equity/bond markets?
For the equity markets the rising GDP will contribute to a stronger currency and
more profitable companies. On the bond market there is the interest rate
parity principle at work helped by institutions chasing the best performing
markets(in a nutshell). Is this all nothing more than grabbing the
attention of investors? Email us
your thoughts.
Sept 25/04 - In a week of rising oil and gold prices the
market that performed the best was the resource based
TSX market. The
US 10 year notes continued to perform exceptionally
well and there has been some talk that the major buyers were offshore hedge
funds. The hedge funds are in some cases use trend following strategies.
This method will produce high returns when the market makes extraordinarily high
or low returns, in this environment that strategy at marketpit may slightly
under perform but will produce a lower risk profile in the longer term.
Hedge funds just like leveraged investors pay for improved performance by
accepting the probability of a large loss ( large enough to liquidate many hedge
funds thus skewing the overall performance of hedge funds will survivorship
bias). Our leading inflation strategy is
showing inflation being kept under control in the near future and thus there is
increased chance the US economy growth rate will continue to slow. Lets
wait for more economic data before this theory comes to be confirmed or our
indicators show a turnaround coming. On a final note the
Australian equity market continues on into record
territory.
Sept 18/04 - In a surprise move we did not see
Oil go on a sell signal even though it fell from 48
to the 42 level. This underscores our strategy to not give in to momentum
traders - the price has once again swung up to 45.60 from under 42.
The other major development is in the short term yields as
commercial paper (corporate t-bills) are
quickly on the upswing - this does not bold well from a standpoint of there
credit worthiness. The other commodity that gave us a swing is
Gold that is now pointing north - lets wait to see
what develops. On commodity that needed no waiting was
Lumber as it fell 29 points or over 7% since our
signal last week - sometimes there is a degree of luck (or was it that insiders
knew of the lumber agreement to come and of handing out of forest contracts in
BC due to beetle infestation). The market indexes are still strong but we
are of the opinion they are long in the tooth and a pullback is coming - lets
let our Russell 2000 trader keep us
updated. You also may have noted we added four new value indicators to our
homepage as items of interest to value or fundamental traders. Have a
great week.
Sept 10/04 - IT was a good week for equities as our main
index the Russell 2000 surged higher. It
looks like inflation as noted in our previous post is also on the downswing and
that does not bold well for corporate profits, the do not have any pricing
power. The only people using pricing power will be the insurance
companies, they will be coming in like a hurricane to clean up our premiums.
We would like to thank all the people who have helped spread the word about our
site as our traffic has doubled in the last few weeks. Our main focus is on
asset allocation and weekly trading, overtrading can drain your wealth. As our
chart of the week notes there is more upside left in the
Russell 2000 but the
Asset Allocation Model has been fully invested in
10 year bonds for the last 2 months. Bonds are
once again flirting close to the 4.10% from a high in the 4.8% range. The
Canadian currency is strong thanks to higher interest
rates and a growing economy. The weakness in the US Dollar seems to be
continuing and there is no reason to see a reversal anytime soon, stay tuned as
our logarithms will keep us well positioned when it does turn.
Sept 04/04 - In market returns, alpha is considered the gold
standard for return. This is not as easy thing to manufacture or continue
to do on a continous basis. The banks got the best way for some alpha
headstart - borrow short term and lend longer. You make the deposit at 1%
and your neighbor gets to borrow the money at 5%. Its hard to find a deal this
good for the banks or anyone else for that matter. Sometimes the markets
can get us a better return than the banks but we also are taking riskier bets.
One of the best ways to make money in hte markets is to let someone take the
risks, this could involve selling options or futures for a nice premium.
Another method is to diversify assets into stocks, bonds, commodities and
currencies. That is the picture we are trying to present to our visitors -
the gains come at the beginning of a rally - sell future profit potential to
someone else. When indexes move away from the averages people tend to get too
excited. The best way to profit from the markets is to move in before the
momentum, and who creates the momentum - its people like the large institutions
but begins with small investors as what is commonly referred to as "noise". We
believe noise traders are a part of the new landscape as discounted brokers have
brought in all the folks who have something to prove (most likely to
themselves). In final, the alpha we look for comes from momentum driven
and small cap tilted markets.
Aug 28/04 - The week was a good one for equities, as investors are jumping on
the oil down stocks up syndrome. We are posting a special fundamental
indicator for inflation with a future projection of
downside pricing to come. You will also notice that gold is on the bottom
part of the chart, it looks like there is some relationship between them. Our
leading inflation indicator is one type of chart
that we are only offering for our institutional customers. Looking to find out
is there is interest in British (London Stock Exchange) securities.
Contact us if you would like to see a
ftse or FTAS chart with a
trading strategy linked to it (currently only provided to one client).
Aug 23/04 - Sorry for the delay this week, I was out of town longer than
anticipated. It still looks like the main story is the oil market and we see no
sign of a turnaround this week. Further the US Dollar is continuing to
face weakness against other currencies and this will also likely continue.
There has been a lot of talk of hedge funds moving every single market we are
aware of but we find that hard to swallow. The more likely reason is that
hedge funds are growing and the media is catching on that hedge fund news is
newsworthy (prior to this they would get the opinion of some mutual fund
manager). We have also designed a micro cap trading strategy, let us know
if this is of interest to yourself.
Aug 14/04 - It was not a pretty week on the street, all indexes were hitting
new lows for the year. The only place to hide was in
bonds. The new place to go looking will be in the gold market, even though
it ended down for the week we still received a buy signal (this is on area that
we are different than most traders using momentum strategies), we attempt to
gain profit from the momentum as well as other technical trading strategies.
The online financial sites were filled with what investors are doing wrong, were
where they for the last few weeks before the drop when you could do no wrong.
On the world economy the big picture was oil, there
just isn't enough above the ground that is. Lets see if we can reach the
50.00 dollar mark, then maybe there might be a large uptick in inflation.
On the world indexes I found the Australian
ASX small cap index to be defying the odds and is continuing to rise to
almost new 52 week (yearly) highs. I have decided to include that index
with our
www.tsxtrader.com site as it is also a
commodity based index as are many tsx traded securities. For more info on the
ASX index please visit www.asx.com it is listed
as S&P/ASX SMALL ORDINARIES index under the symbol
XSO .Let us
know your thoughts on trading this
index.
Aug 07/04 - Just when you thought everything was going to be great with the
economy it is now shaping up to look like a downturn. Does it all really
have to do with oil prices or is it just that we have spent all we were going to
spend. Since money is cheap there should be lots available for the asking
(credit). The persons who are happy to get the credit and charge it to
your account are the people of the hedge fund industry. Just as mutual
funds look like they were charging high prices compared to etf's, the hedge
companies are along to save the day by charging a mininum of 5% with 20% of
profits. In my opinion they are no smarter than the average financial
community as a whole, so you can figure out why you would pay them more. Getting
back to the markets at hand , our asset allocation
models have been in bonds and out of stock as have our other 2 index models.
This is the easy part, the next issue is to catch the rally back up when it is
time. Gold on the other hand should have been moving but do to various changes
in the policies of financial firms they are delaying buying, it may however
change next week with changes by the Fed to the rates. Look for the
markets to continue their move down and gold to possibly start a rally by weeks
end esp. if the fed leaves rates unchanged. It looks like people are just
looking for a reason to dump US holdings.
Aug 01/04 - According to the chart above
Oil price are not about to
come down anytime soon and this will leave the Fed and the
Bond Market little choice but to chase rates higher. Other
researchers are now focusing on nonlinear models, using such regression models
as ARCH, regime change and eccentric ideas to attempt to forecast rates and the
bond market. From all the research that we have seen these models show
little conclusive evidence that they have any predictive power. Once again
our concerns are of data snooping and small (non-random) sampling. The
market is showing weakness as traders look for other ripe markets, such as
currency trading, lumber and obviously
oil. I would like to add that it is better to have a trading plan than having to
rely on the news (CNBC) or attempting to pick individual securities (low
information ratio and high trading costs).
July 24/04 - The biggest news this week is not about the markets but how
money is now being moved into the US Dollar. The Fed continues to point to
higher rates and the USD is moving higher in anticipation of that promise.
The Canadian Dollar above is now set to move lower along with all other non-us
currencies. We would like to welcome
TSXTrader.com visitors to our commentary section. In the future there
will be a separate commentary for the Canadian Market. The strenth of the
USD is also showing up in the GOLD market - watch this market for confirmation
of a big change coming in the Interest Rate market. If you feel you might
be able to write a column for our site please email us at
marketpit1@yahoo.com .
July 17/04 - It was not a good week on Wall Street except for
bond traders, where is one area we have
been bullish for the last few weeks. Inflation seems to be coming down
(only temporary in our opinion) and all the hedge funds are hiding for cover
from any SEC action coming down on the industry (they have to get rid of some
questionable investments before the SEC looks into them, forget about the
customers - they most likely have no clue and are the sheep of very coy
marketing ploys by these funds). After all survivorship bias does not
bias- a new investors opinion, only a veterans. As our long
term asset allocation system shows it is just best to avoid the markets
currently and take a holiday. That is exactly what I am going to be doing.
July 10/04 - It looks like the situation for the markets is not looking good
as the longer term trading patterns of
institutions has turned down. The biggest problem when trying to
anticipate the markets is having too much information of which most is so called
"noise". There is no use using all the info that is therefore available,
such as most financial firms and hedge funds would have you believe, they all
are like typical investors and see things were none exist o if the do exist they
are likely to disappear, especially after they are published. To the
markets now where they continue to drop due to low volumes as outlined below and
in favor of precious metals as they
gave a good return this week. Once a winner - you are likely to stay with
them just like any other speculative sport.
July 07/04 - It look like the longer
trend for this market is now southbound. This is not good news for the
financial markets as lower volumes mean more severe swings. The price of
oil is now a significant contributor to loss of disposable income and company
profits. Look for the USD to continue weaker as
Gold seems to be moving steadily higher on the back of inflation. If
there is good news forthcoming it seems to be only in the press, lets wait and
look for lower prices for re-entry when the election is closer.
July 03/04-It was a week dominated by Fed news and investors nervous about
what is next in the middle east. This is the problem with investors, the major
institutions (banks) do not invest like that, they look at the risks of an
investment and the security of another investment. If we were to believe
that interest rates have nowhere to go but up - the
bond market would have plunged by now.
Our chart of the week the Canadian Dollar continues to be strong even with a
minority government as there economy policy will not change much from the status
quo. The US economy is shows signs of slowdown in manufacturing
and job creation, this is leading to the Fed in no rush to raise rates until
further signs of inflation. We got an important signal from OPEC this week
that crude oil at 36.00 a barrel had fallen far enough. They are just
getting the privileges of more income and do not want to lose any of it - if the
US does not want their oil there are lots of other takers to fill the tankers.
We should not insulate ourselves from situations that we do not understand, but
let them develop and see if we use them in our analysis. The problem with
security analysis is that it is not just a game of numbers but a game with many
faces of discipline. To a financial analyst most stocks look different in
the banking world they look the same and the only difference is not between
stocks but between alternatives.
June 30/04-Sorry, we must have gotten some bad data, it appears the gold
system is still on a buy signal. It will be cheaper to buy this evening as the
price fell today. The market looks strong going into the July 4 holiday.
June 29/04 - Site has been updated as more people have sent us emails
regarding our gold system. It has
done a 180 turnaround and is now on a sell signal. The markets are
trending higher and should continue. Sometimes we are going to be wrong at the
wrong times but are logarithms have proven their worth and continue to point us
in the right direction.
June 26/04 - The major question this week will be the valuing of the US
Dollar, it is strong against the Europeans but is weak against the Yen and
CDN dollar. This leads us to conclude
there is some influence going on with the Cdn dollar due to the upcoming
election and when this passes, the true Cdn value will start to decrease.
The Yen is another story and is holding strong as here economy gains strength.
The picture for Gold is as bright as the metal itself - lets see if it can break
its old records of 430.00 . If banks are looking to increase there cash
levels they will be selling the US dollar and buying metals - but the
CRB index is still on a sell.
Lets see what the fed has planned, they are kind of stuck knowing that most
people have rates that are tied in short term and small changes will allow the
banks to move rates, thus increase there profits on those what are already past
there limits. It looks like small increases are there only option.
June 24/04 - Our Gold system just went on a buy signal today and we expect
the trend to continue through at least next week. Also the markets look to
move up strongly.
June 20/04-It was a week of low volumes and low turnover, people are just
waiting to see what comes next. We are certain part of the trading
activity has gone to the ETF group and what is known in the industry as index
creation. There seems to be a bearish mode for the US Dollar, but our
charts are starting to show strength as gold is getting weaker as it works its
way to the 400 level and bonds are awaiting news prior to their next downturn.
We may however change our views should new events occur in the following week.
In the world of economics it is better to stay simpler, if one has knowledge of
advanced mathematics they are likely to use it and have it fit their mode of
thinking. Keeping it simple will allow the key market players to drop us
clues of the supply and demand equation. The
British Pound (chart of the week) with its
higher interest rates is not enough to keep the currency strong against the USD,
and the
T-notes are still showing weakness
indicating the US Dollar is about to receive some strength. Look for the
markets grind higher on the strength of the greenback as bank analysis shows
funds moving to attempt to receive greater returns.
June 12/04 - IT is better to be mostly right then being terribly wrong and
that is what our Monthly Market Index
attempts to provide. It has just flashed a new signal indicating the rally
is about to go full steam ahead. It is composed of the S&P 500 divided by the
bond market and attempts to show how investors are valuing each of these
markets. It may have been started by Victor Niederhoffer but I'm not sure he
ever did any follow up type of analysis. Here is a link to the article
previously on MSN: http://moneycentral.msn.com/articles/invest/speculator/6695.asp
June 11/04 - There have been a number of comments by the Federal Reserve
indicating that they are preparing the public for either one large interest rate
increase or many small increases and that the will be made according to
inflation conditions. Our bond analysis are showing long term bond
declining further and a large jump in the USD. Both of these signals
occurred on June 09/04 Midday and you could have established positions on June
10/04 at even better prices. Look for traders taking positions on Monday
after more comments by the Fed over the weekend. We guess people thought
not much would change over the weekend and are treating it as a long weekend,
just when you thought you could relax the bankers have started moving positions
via the overseas markets and the currency markets that remained open on Friday.
June 09/04 - Lets begin by introducing myself, I am
from North America and have been interested in the markets for over the past 20
years and have traded most financial instruments. I have been employed in
the Securities industry for the last 15 years and have been actively creating
logarithms (trading strategies) with the owner of the
www.oextrader.com for the last 7 years.
He has an excellent dow trading system on his site. It has only been the
last 3 years that I decided to look into trading patterns of banking
institutions and found that they trade just like the rest of us when they are in
the buying mode but that they are much different when they look to exit
the markets. Everyone is a Genius in a rising market but it is the
bankers logarithm that allows us to profit from the down cycle in the
short and longer term cycles. The analysis is based on the movement of
funds between currencies, gold (another form of currency and not a bank favorite
- no dividends or interest) , bonds and the stock market. Just read about
Bankers Profits and look how much of their gains come from trading activity.
Further, we will let our analysis as shown by signals on the various charts
shed light on the future direction of the markets that we track. Our
charts are easy to read and provide analysis on where the money will be moving
next. The banks tend to follow one another with a new group taking the
lead on the next big move. Let us not allow you to be left in the dark with
losses and risk that is no longer acceptable. Whatever financial instruments you
may trade, we are sure you will find much value in our analysis so you can spend
the time doing things that you do best.
Doing this is better than working as we are always looking for a good puzzle
and there is no larger puzzle than the markets. Nobody can not make profits
doing what others do, we must have an edge in the game (like the casinos, banks,
wal-mart, etc..) and most importantly we must be careful in avoiding unnecessary
downside risks. We will let our analysis and hard work speak for themselves as
they have in the past.
|

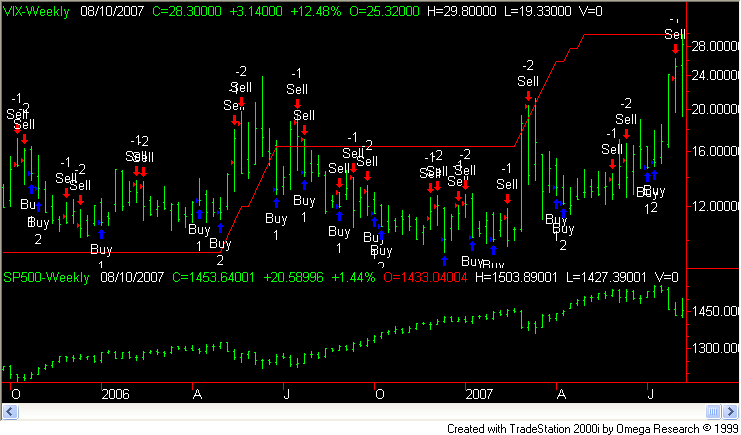
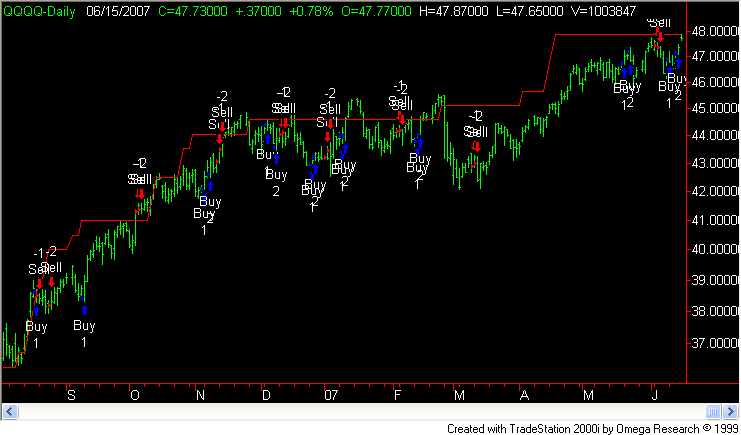